Peak-calling strategies
The peak-calling stage finds polyadenylation sites (PAS) within each merged
"peak region" (a stretch of contiguous 3'-end coverage). PeakATail ships five
registered strategies — each implements PeakFinderStrategy in
ema/strategies/, each registered via @register("<name>").
Selection is CLI-level: peakatail run --peak-strategy <name> or strategy: in the
YAML config.
Strategy overview
| Strategy | Class | Best for | Multi-PAS? |
|---|---|---|---|
original |
OriginalStrategy |
A/B baseline; matches the legacy Peak.pasfind() output exactly |
1 PAS per region only |
lambda_poisson |
LambdaPoissonStrategy |
MACS2-style single-peak detection with local background | 1 PAS per region |
sierra_iterative |
SierraIterativeStrategy |
Recovering multiple PAS per 3' UTR (closest to Sierra, Patrick et al. 2020) | Yes — iterative subtraction |
lambda_gradient |
LambdaGradientStrategy |
Multiple-PAS detection with Poisson significance per candidate | Yes — gradient-based candidate detection + per-summit test |
clip_seeded |
ClipSeededStrategy |
Accuracy. Seeds PAS from read-level poly(A) soft clips and reports coverage-only peaks as an explicit second tier | Yes — one PAS per clip cluster, plus tier-2 coverage peaks |
The first four strategies see only coverage shape and cell barcodes.
clip_seeded is the only one that uses orthogonal, read-level evidence; see
its section for why that matters and what it costs.
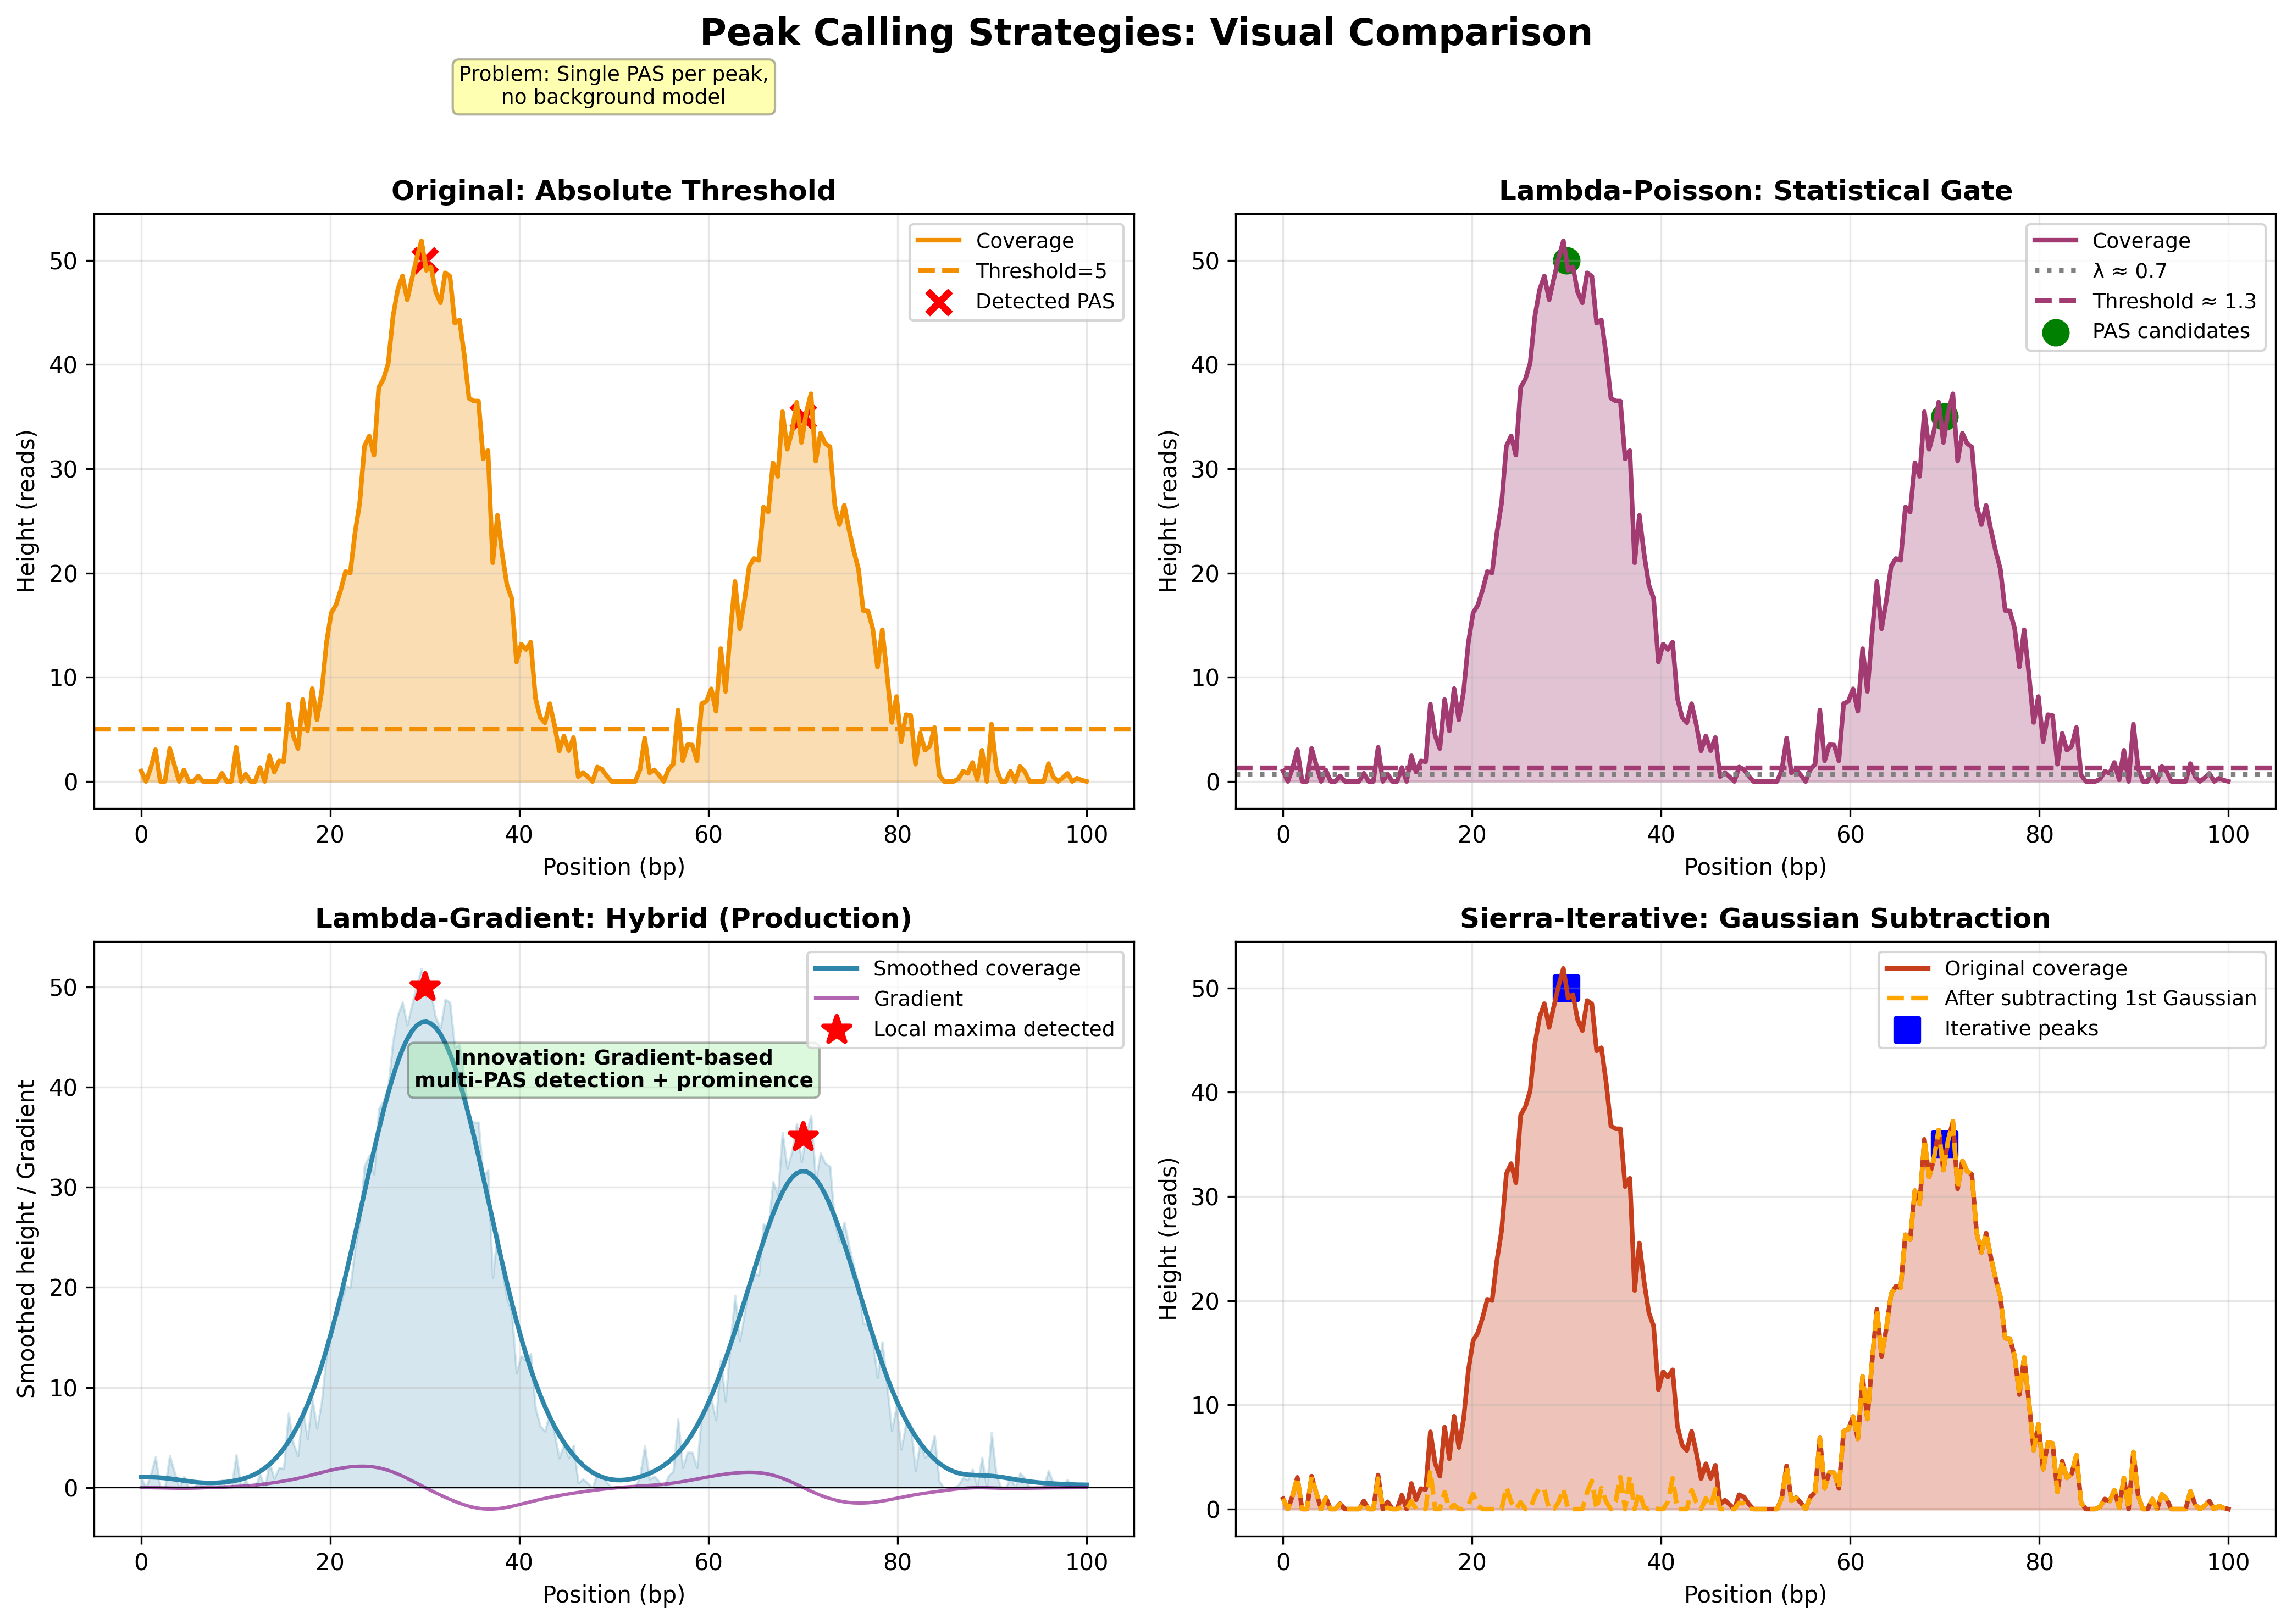 Strategy-level comparison across the benchmark set: number of detected PAS,
agreement with reference annotation, and runtime. Source: PeakATail Technical
Report (Mar 2026), Figure 2.
Strategy-level comparison across the benchmark set: number of detected PAS,
agreement with reference annotation, and runtime. Source: PeakATail Technical
Report (Mar 2026), Figure 2.
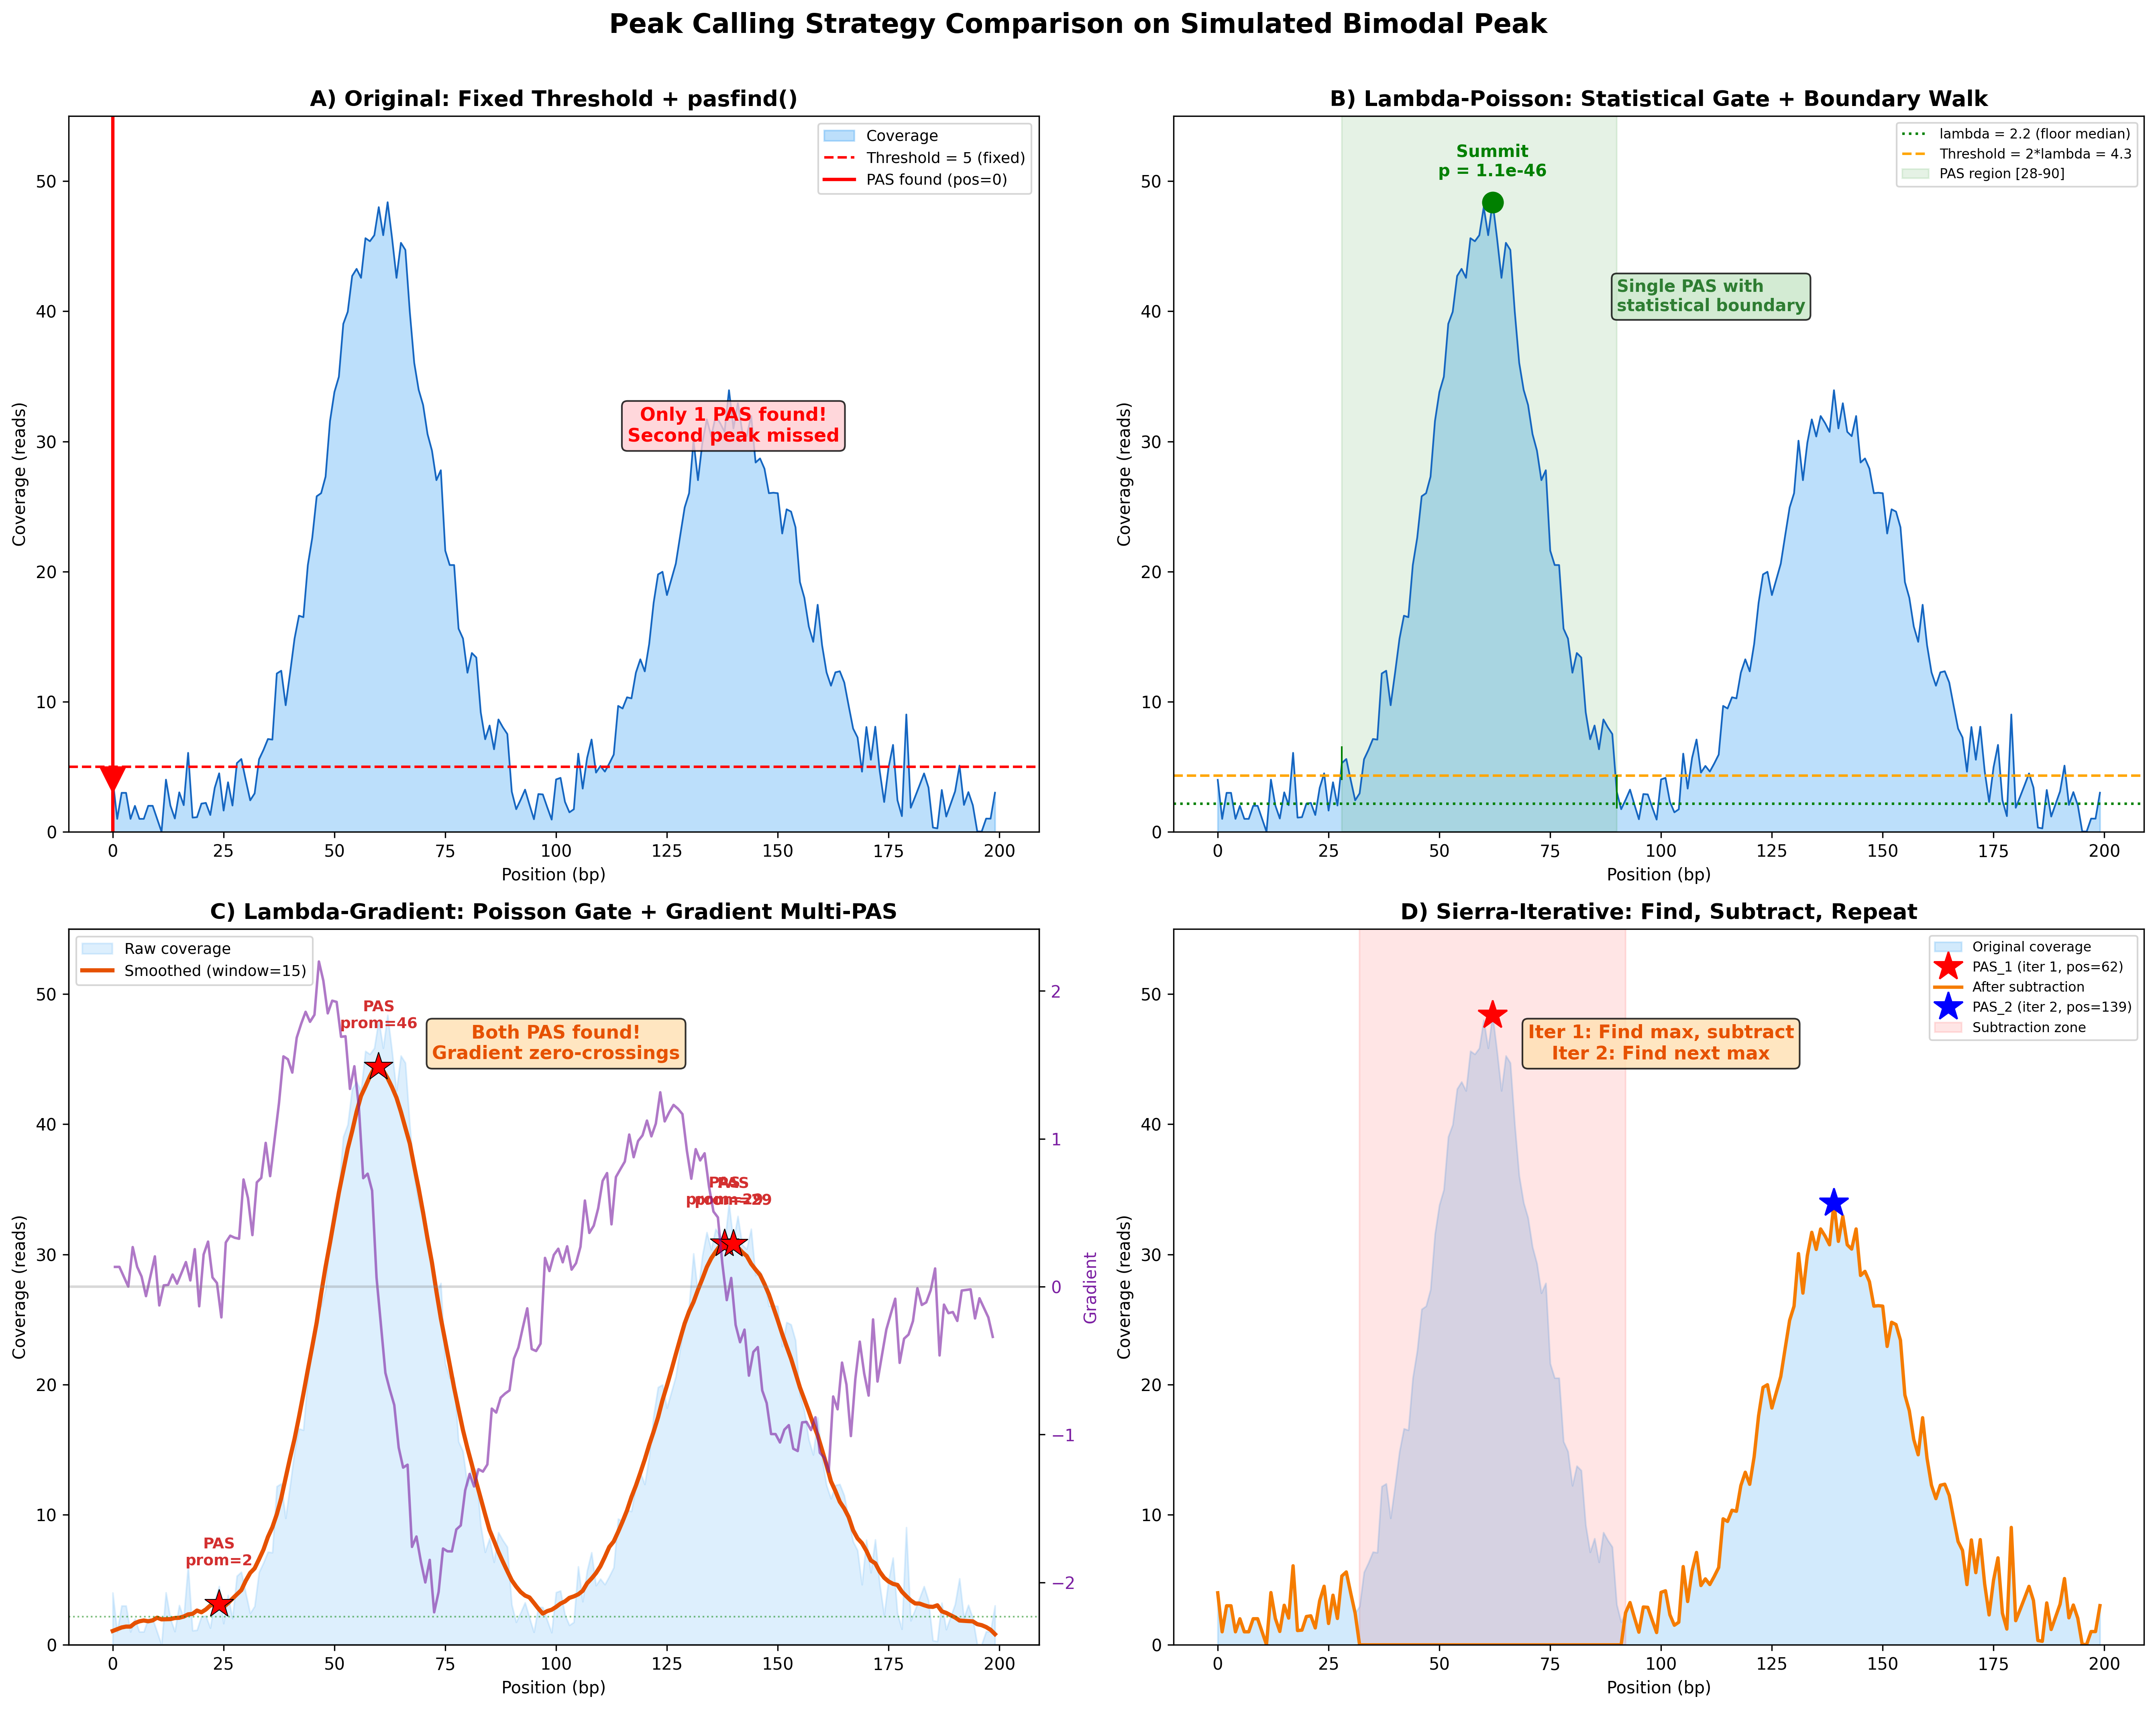 One-glance summary of each strategy's algorithmic idea — summit detection
(original / lambda_poisson) vs iterative subtraction (sierra_iterative) vs
gradient + significance (lambda_gradient).
One-glance summary of each strategy's algorithmic idea — summit detection
(original / lambda_poisson) vs iterative subtraction (sierra_iterative) vs
gradient + significance (lambda_gradient).
original
Registered name: original
Source: ema/strategies/original.py
Wraps the legacy Peak.pasfind() method unchanged. Produces IDENTICAL output
to the pre-refactor PeakATail code path. Exists so new strategies can be
evaluated against a frozen baseline.
Algorithm
- Call
peak.pasfind()on each peak region. - Return the (pas_1, pas_2) tuple — typically the single summit position.
Tunable hyperparameters
None. By design — this strategy exists to be deterministic.
When to use
A/B comparisons against new strategies. Reproducing old results from a previous PeakATail version exactly.
Limitations
Returns at most one PAS per peak region, even when a region clearly contains multiple distal sites. This was a recurring source of recall loss before the iterative strategies were added.
lambda_poisson
Registered name: lambda_poisson
Source: ema/strategies/lambda_poisson.py
MACS2-style: compute a local lambda from the region's background positions,
then test the summit's height against Poisson(lambda). Keep the summit as a
PAS only if the one-sided p-value beats alpha.
Algorithm
- Identify the summit position (max coverage) in the region.
- Compute
lambdafrom "floor" positions — positions with depth belowfloor_fraction × max_height. Thelambda_methodcontrols aggregation ("median","percentile20", or"global"). - Test
H₀: summit_depth ~ Poisson(lambda)one-sided. - Discard if
p ≥ alphaorsummit_depth < min_height.
Tunable hyperparameters
| Name | Default | Description |
|---|---|---|
lambda_method |
"median" |
Background aggregator — median is robust; percentile20 is more conservative |
min_height |
20 | Hard floor on summit depth before any p-value test |
alpha |
0.05 | Poisson p-value threshold |
floor_fraction |
0.1 | Positions below this fraction of max-height define the background |
When to use
Single-PAS regions where you want a statistical significance filter on noise peaks. Good baseline for benchmarking precision.
Limitations
Returns one PAS per region — multiple distal sites in the same UTR will
share a single called summit. Use sierra_iterative or lambda_gradient for
multi-PAS recovery.
sierra_iterative
Registered name: sierra_iterative
Source: ema/strategies/sierra_iterative.py
Based on Sierra (Patrick et al., Genome Biology 2020). Iteratively peels off the dominant peak from the coverage profile, then repeats — naturally surfaces multiple PAS per UTR.
Algorithm
- Find the position of maximum coverage; record as a PAS.
- Zero out a
±subtraction_windowneighbourhood around that position. - Repeat until either the remaining max falls below
min_heightAND belowmin_fraction × original_max, ormax_pasPAS have been called.
Tunable hyperparameters
| Name | Default | Description |
|---|---|---|
subtraction_window |
300 | bp zeroed-out on each side of every called summit |
min_height |
20 | Absolute minimum coverage for a position to be considered |
max_pas |
5 | Hard cap on PAS per region (safety) |
min_fraction |
0.1 | Stop when next peak's height < this × original max |
When to use
Whenever you want multiple PAS per UTR — the typical APA-discovery setup. The closest analog to the well-validated Sierra method.
Limitations
- No statistical significance test; iteration stops on raw-height thresholds
alone. Use
lambda_gradientif you want both multi-PAS recovery AND a per-summit p-value. - The subtraction_window is uniform regardless of underlying peak width — fine for typical 100–300 bp PAS clusters but may over-merge in longer-isoform regions.
lambda_gradient
Registered name: lambda_gradient
Source: ema/strategies/lambda_gradient.py
Hybrid: gradient-based candidate detection (smoothed coverage local maxima), then per-summit Poisson significance with locally estimated lambda.
Algorithm
- Smooth the coverage profile with a centered moving average of width
smooth_window. - Identify all positions where the first derivative crosses from positive to non-positive — these are candidate summits.
- For each candidate: estimate local
lambdafrom neighbouring floor positions and run a one-sided Poisson p-value test. - Apply
min_heightfloor andalphasignificance filter. - Merge candidates within
merge_window(so two summits 50 bp apart from noise oscillation collapse to one).
Tunable hyperparameters
| Name | Default | Description |
|---|---|---|
smooth_window |
typical 11 bp | Width of the moving-average smoother |
min_height |
20 | Absolute minimum summit depth |
alpha |
0.05 | Per-summit Poisson p-value threshold |
lambda_method |
"median" |
Background aggregator (same as lambda_poisson) |
merge_window |
typical 100 bp | Merge summits closer than this |
When to use
When you want multi-PAS detection and a statistical significance filter on each individual called PAS. The most expensive strategy per region (smoothing + per-summit test) but the most defensible for downstream differential testing.
Limitations
Smoothing trades sensitivity for noise robustness — narrow PAS (<10 bp) can be
suppressed by the moving average. If you see PAS recall drop on short
isoforms, reduce smooth_window.
clip_seeded
Registered name: clip_seeded
Source: ema/strategies/clip_seeded.py, ema/countmatrix/polya.py
The only strategy that uses evidence other than coverage shape. PAS candidates are seeded from read-level poly(A) soft clips — the non-templated A (or T, on the minus strand) tail a read carries when it was sequenced through the cleavage site — rather than being read off the coverage profile alone.
Why seeding and not filtering
On the pbmc_10k_v3 BAM, 1.152% of CB-bearing reads carry a qualifying clip and 73.9% of those clip sites fall within 100 bp of a PolyASite 2.0 site (the same statistic for an arbitrary read 3' end is 13.9%). But ~60% of that clip evidence lies outside every coverage-peak window, so no post-hoc filter on coverage peaks can reach it. Candidates have to start from the clips.
Algorithm
- During peak calling, every read that passes
read_checkis measured withpolya.clip_site(); qualifying clips accumulate per chromosome (this is caller-level, not per-peak — a strategy only ever sees one peak window). - Clip sites are clustered by single linkage at
--polya-seed-window(25 bp). - Each cluster clearing
--polya-min-umisdistinct(barcode, UMI)molecules is emitted as a tier-1 PAS at the cluster's read-weighted modal position, as the 1-bp interval[mode, mode+1). Molecules — not reads — are the support unit: a PCR stack of ten reads is one molecule. Cluster geometry (membership and the mode) is a pure function of the accepted clip reads, so changing the support unit or the gate can drop a PAS but never moves one. - The inner coverage strategy (
--peak-strategy clip_seededuseslambda_gradientby default) still runs; its PAS that overlap no tier-1 cluster are emitted as tier 2, taggedcoverage_only. - Both tiers go to
pasbed.bedas ordinary BED6 rows. The tier tag is BED column 5: distinct clip molecules, soscore == 0means coverage-only.--polya-mode filterdrops exactly that tier. The raw clip-read count, the-F 3844counts and the matrix-row read count are written per PAS to thepas_support.tsvsidecar (seedocs/cli/run.md), so BED6 stays BED6. - Counting. A tier-1 row is counted from the reads that pile up at its
cleavage site, never from its clip reads alone (those are ~1% of the
reads — column 5 keeps them as the support annotation). A cluster that
suppresses a coverage candidate takes that candidate's
cb_positionscounts, restricted to its partition of the candidate (several clusters split a candidate at the midpoints between their anchors, exactly likefind_passplits a multi-PAS peak); every cluster additionally counts the accepted read ends inside--polya-count-window(default[site - seq_len, site + 25], transcript orientation) that belong to no coverage candidate, clipped at the midpoint to its neighbours — so no read is counted twice and the coverage strategy's mass is a floor. Tier-2 rows are the coverage strategy's rows unchanged. A cluster left with nothing by both sources falls back to its own clip reads, and that fallback is midpoint-clipped and candidate-excluded the same way (a read end past the midpoint is the neighbour's), so such a row can legitimately come out empty rather than double-counted.
Tunable hyperparameters
| Flag | Default | Effect |
|---|---|---|
--polya-min-clip |
6 | Minimum soft-clip length AND minimum A/T run flush against the alignment boundary |
--polya-min-purity |
0.8 | Minimum A (or T) fraction over the clipped bases |
--polya-seed-window |
25 | Single-linkage gap for clustering clip sites |
--polya-min-umis |
1 | Minimum distinct (barcode, UMI) molecules per emitted cluster (deprecated alias: --polya-min-reads) |
--polya-clip-filter |
none |
f3844 restricts the molecule count (and therefore the gate, the score and the tier tag) to reads passing samtools -F 3844; it drops clusters whose evidence is entirely secondary/duplicate/qcfail alignments, so it changes the call set |
--polya-window |
100 | Radius for attributing clip support to a PAS, and for tier-1/tier-2 overlap suppression |
--polya-count-window |
auto,25 |
UP,DOWN bp around a tier-1 cleavage site (transcript orientation) within which read ends outside every coverage candidate are counted on the tier-1 row; auto == --seq-len |
When to use
Accuracy. Measured on chr19+chr21 of pbmc_10k_v3, scored with
scripts/benchmark_tools/score_tool.py against the detected-gene-restricted
PolyASite 2.0 atlas (both arms taken through the identical gene-assignment
stage):
| arm | n | P@100 | R@100 | F1@100 |
|---|---|---|---|---|
lambda_gradient (shipped) |
12,928 | 0.1610 | 0.1956 | 0.1766 |
clip_seeded, both tiers |
19,354 | 0.2371 | 0.3782 | 0.2914 |
clip_seeded, clip-supported tier |
11,318 | 0.3591 | 0.3379 | 0.3482 |
clip_seeded, coverage-only tier |
8,036 | 0.0652 | 0.0404 | 0.0499 |
Precision and recall both roughly double. Tightening the clip-read gate
trades recall for precision along a steep curve — on the same slice,
score >= 2 gives P@100 0.478 at n=6,597 and score >= 5 gives P@100 0.727
at n=2,361.
Limitations
- Hard recall ceiling. Only ~29% of detected-gene atlas sites genome-wide carry any clip read within 100 bp (33.6% on this chr19+21 slice), so a strictly clip-gated call set cannot exceed that recall — and the measured tier-1 recall of 0.3379 is already sitting on the slice's 0.3356 ceiling. Nothing further is available from clips alone. This is why tier 2 exists, and why the two tiers must always be reported separately, with their n.
- Chemistry-dependent. Any pipeline that trims poly(A) before alignment destroys the evidence. The caller warns at startup when the observed clip rate falls below 0.3% of CB reads; treat its output as unsupported when it does.
- Internal priming — a genomic A-run downstream of a cluster (in
transcript orientation; a T-run genomically upstream on
-) — is this evidence type's one systematic false positive, and is not covered by the wrong-end control. Pair with--ip-filter --genome-fasta. - Higher memory than the coverage-only strategies: clip sites and buffered coverage candidates are held for one chromosome at a time.
Performance vs. the reference annotation
The PeakATail Technical Report (Mar 2026) benchmarks each strategy against the PolyASite 2.0 + polyA_DB v4 dual-database reference.
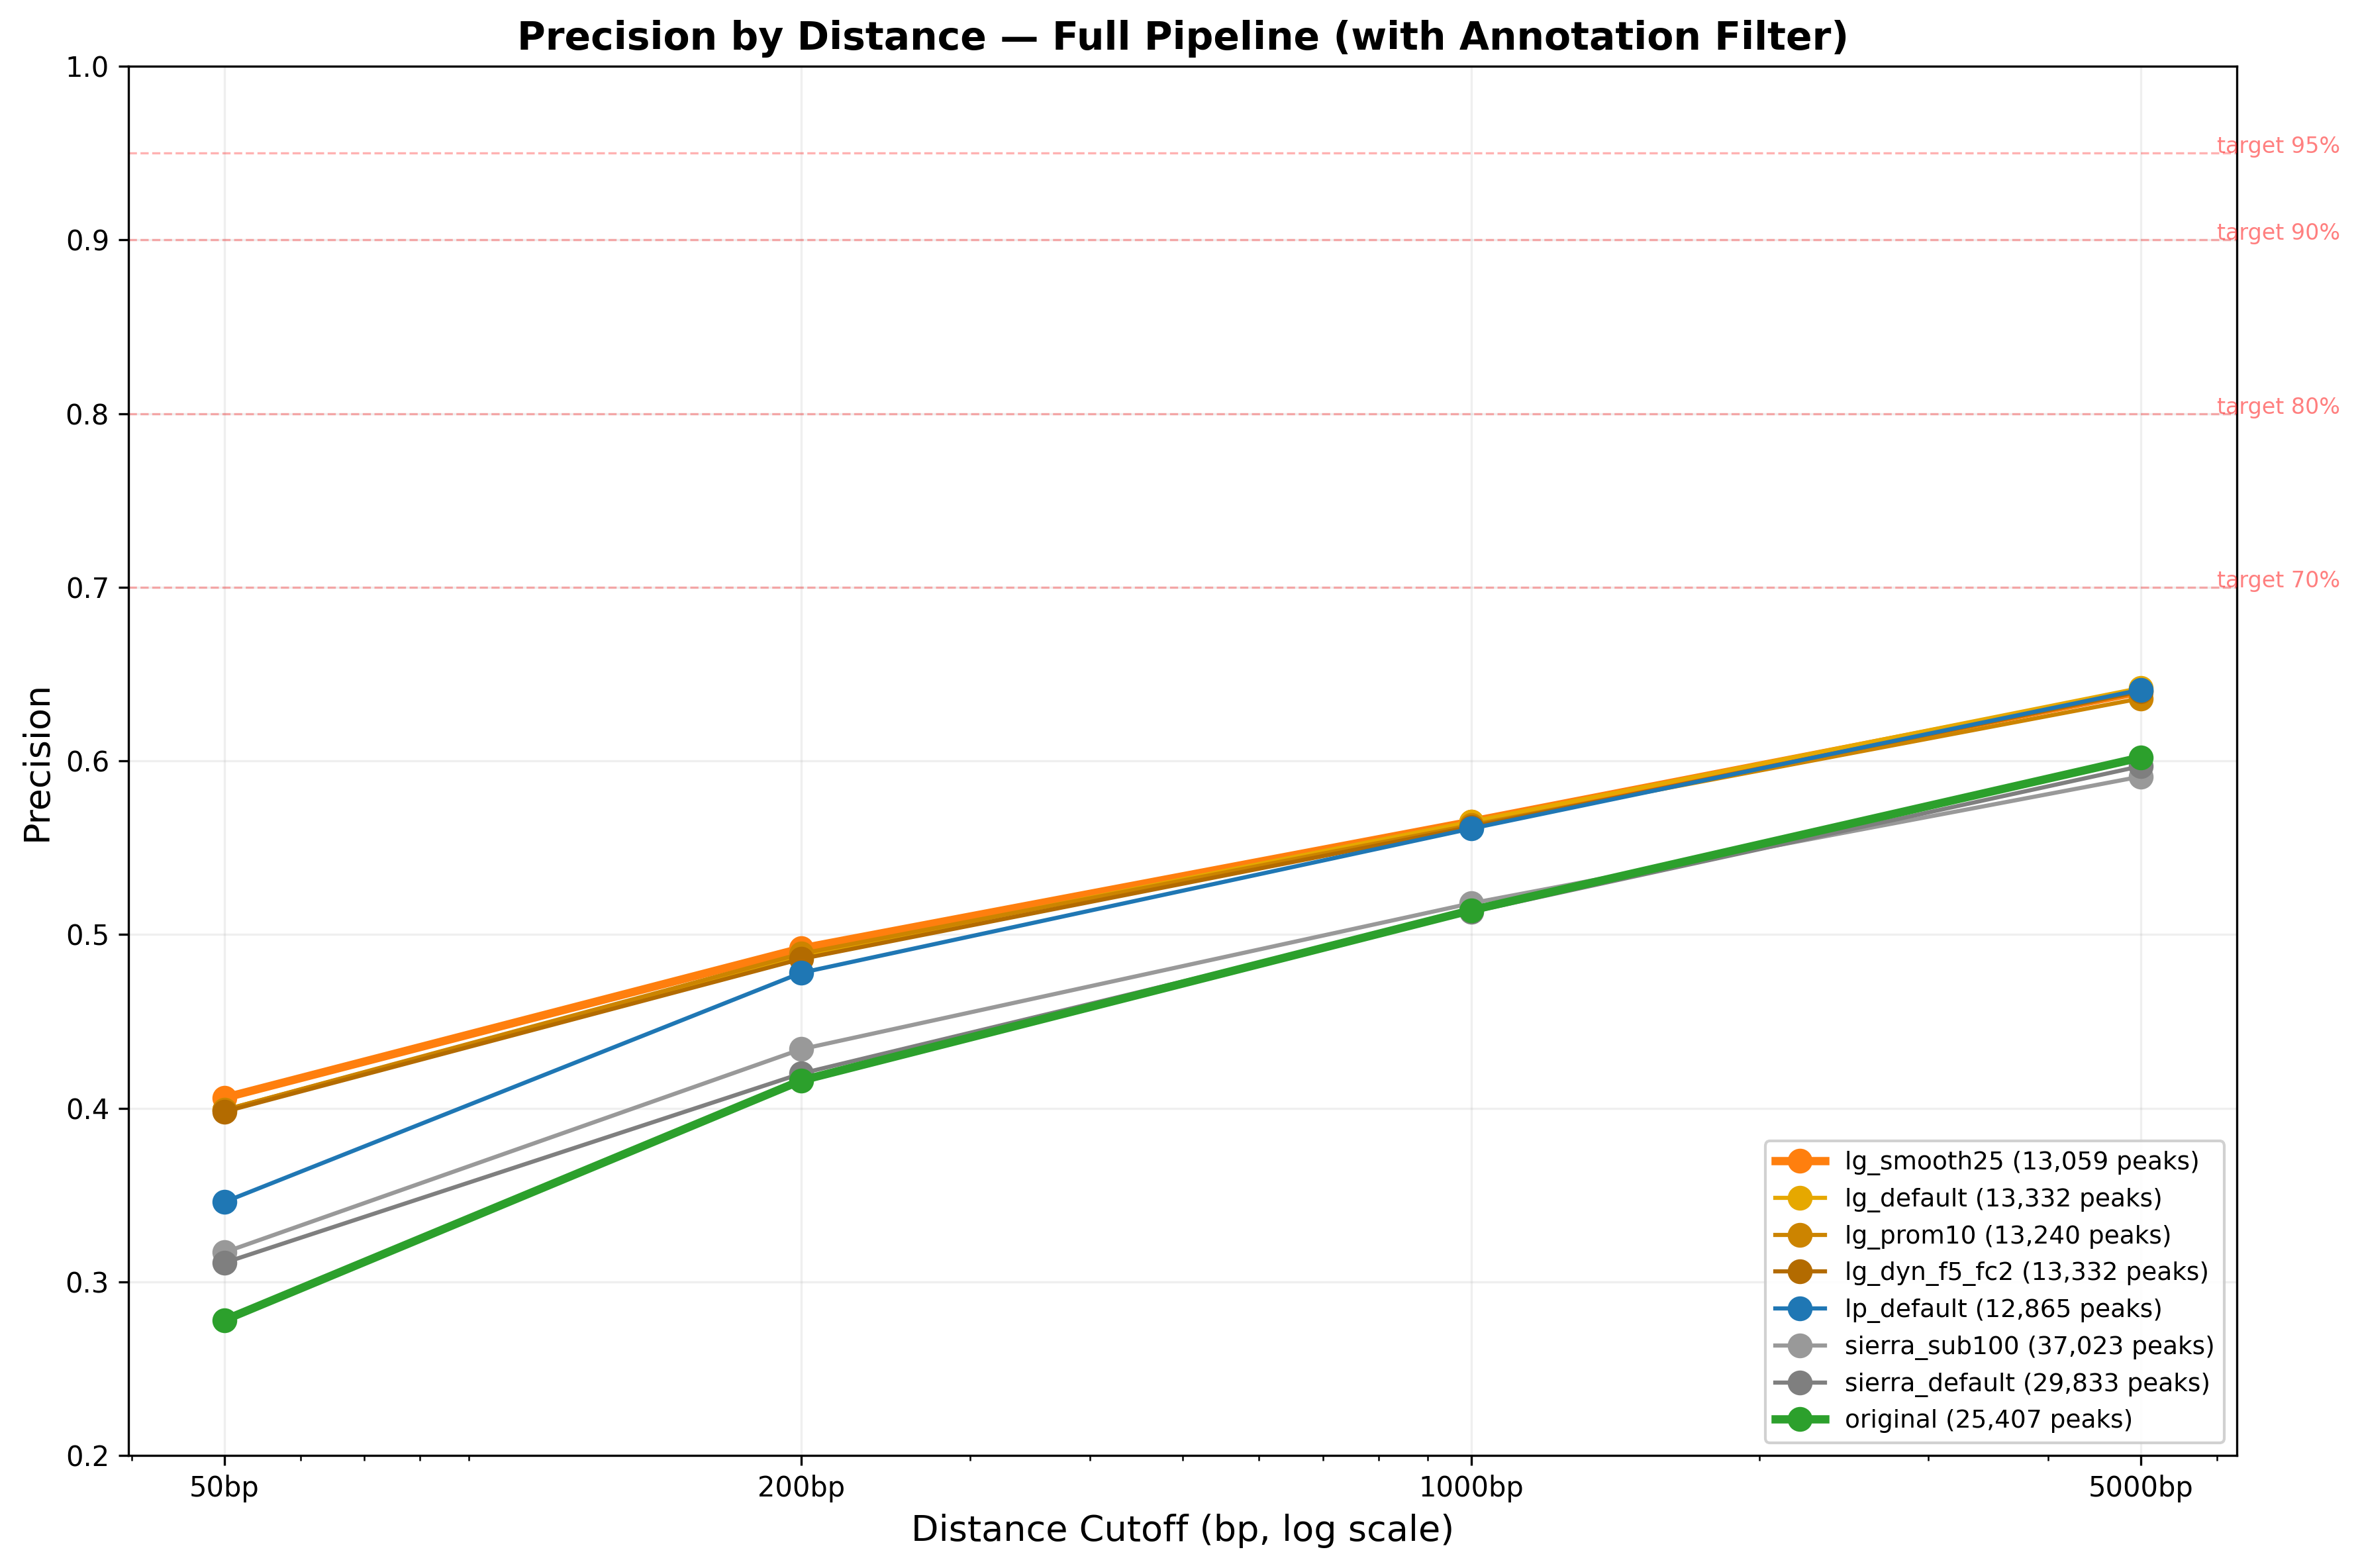 Precision (fraction of called PAS within 50 bp of a reference site) per
strategy. lambda_gradient achieves the highest precision; sierra_iterative
recovers the most multi-PAS hits.
Precision (fraction of called PAS within 50 bp of a reference site) per
strategy. lambda_gradient achieves the highest precision; sierra_iterative
recovers the most multi-PAS hits.
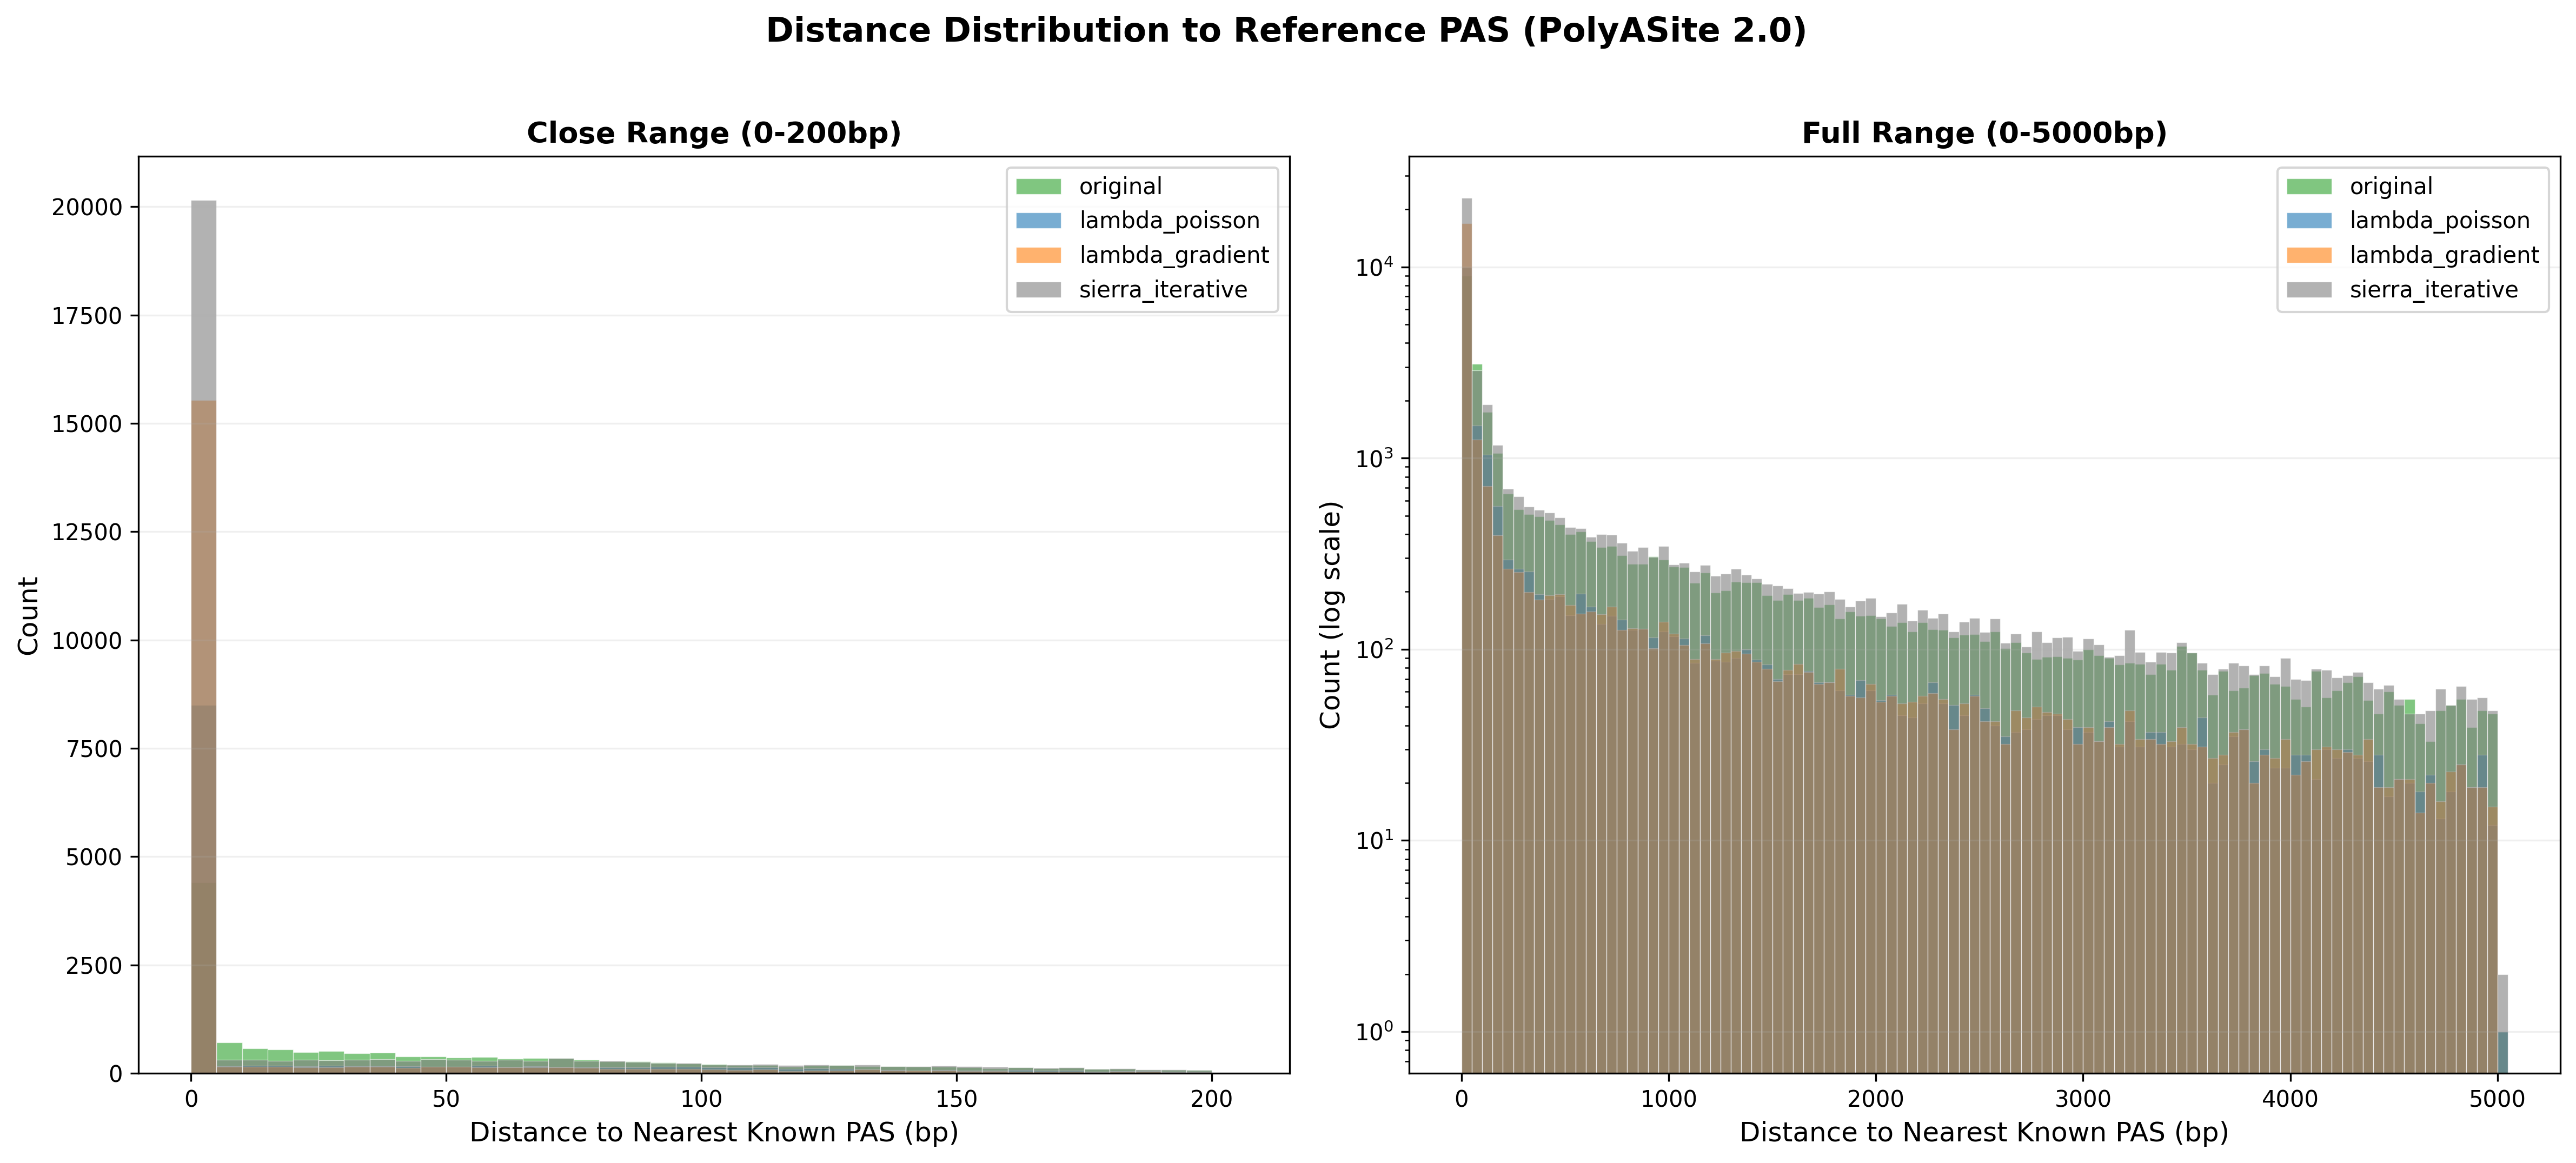 Per-strategy distribution of distances between called PAS and the nearest
reference site. A tight peak near 0 bp indicates accurate positioning.
Per-strategy distribution of distances between called PAS and the nearest
reference site. A tight peak near 0 bp indicates accurate positioning.
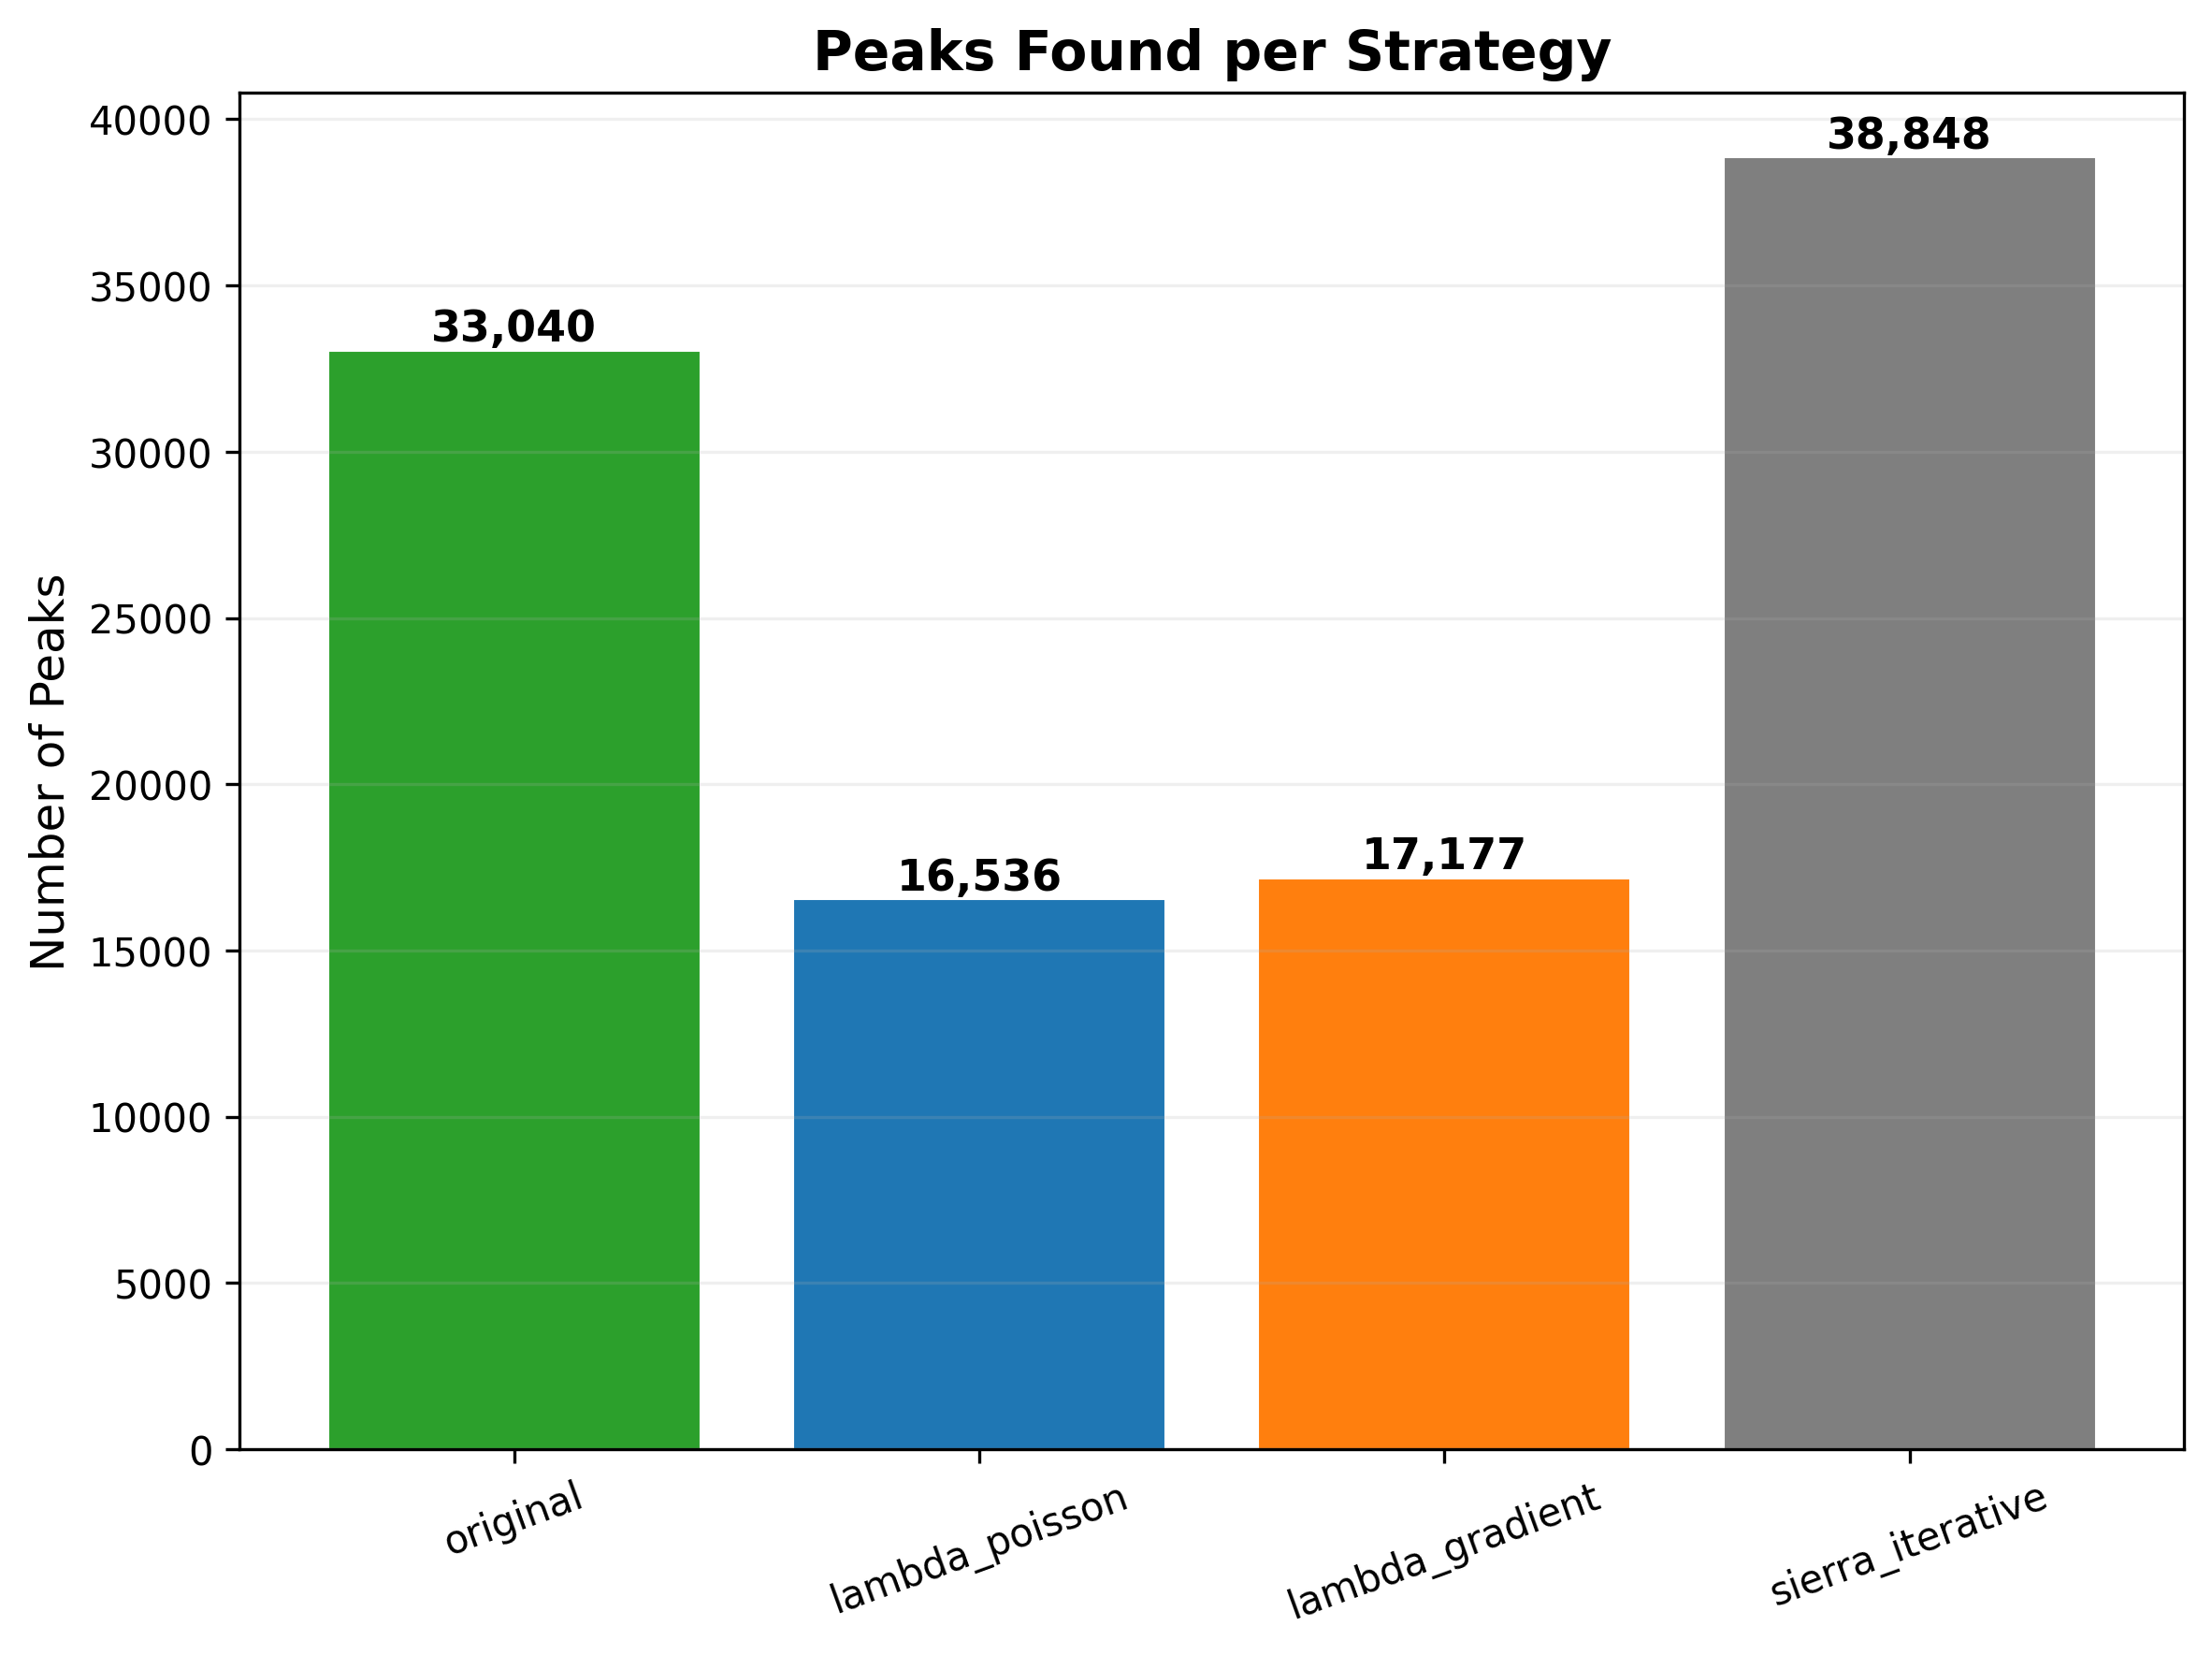 Total PAS called per strategy — the iterative / gradient strategies recover
substantially more multi-PAS UTRs.
Total PAS called per strategy — the iterative / gradient strategies recover
substantially more multi-PAS UTRs.
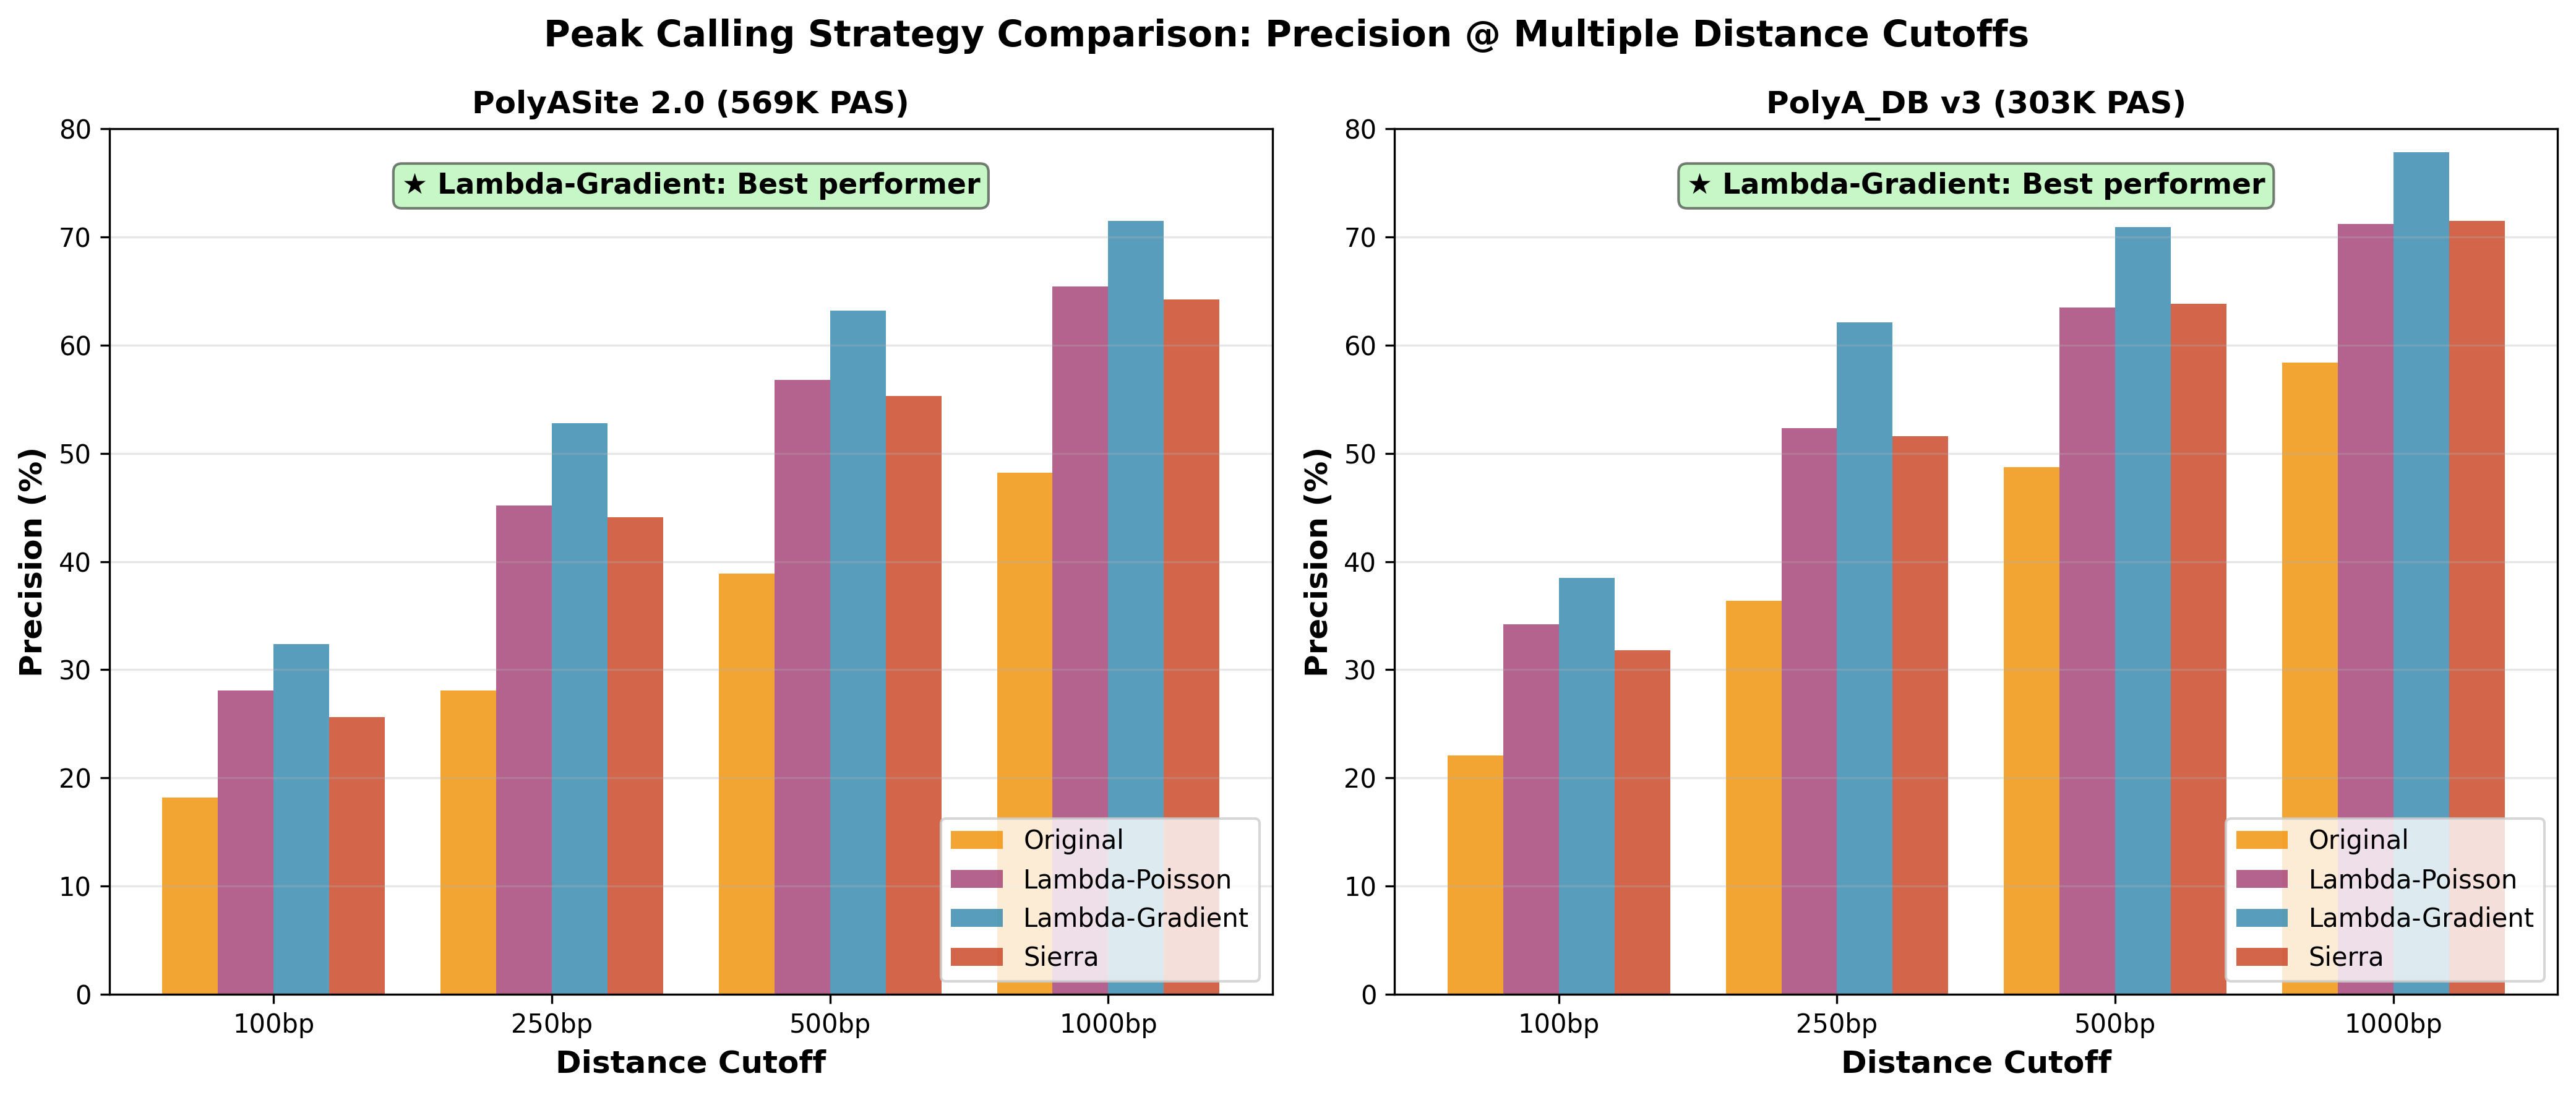 Precision–recall tradeoff across strategies and parameter sweeps.
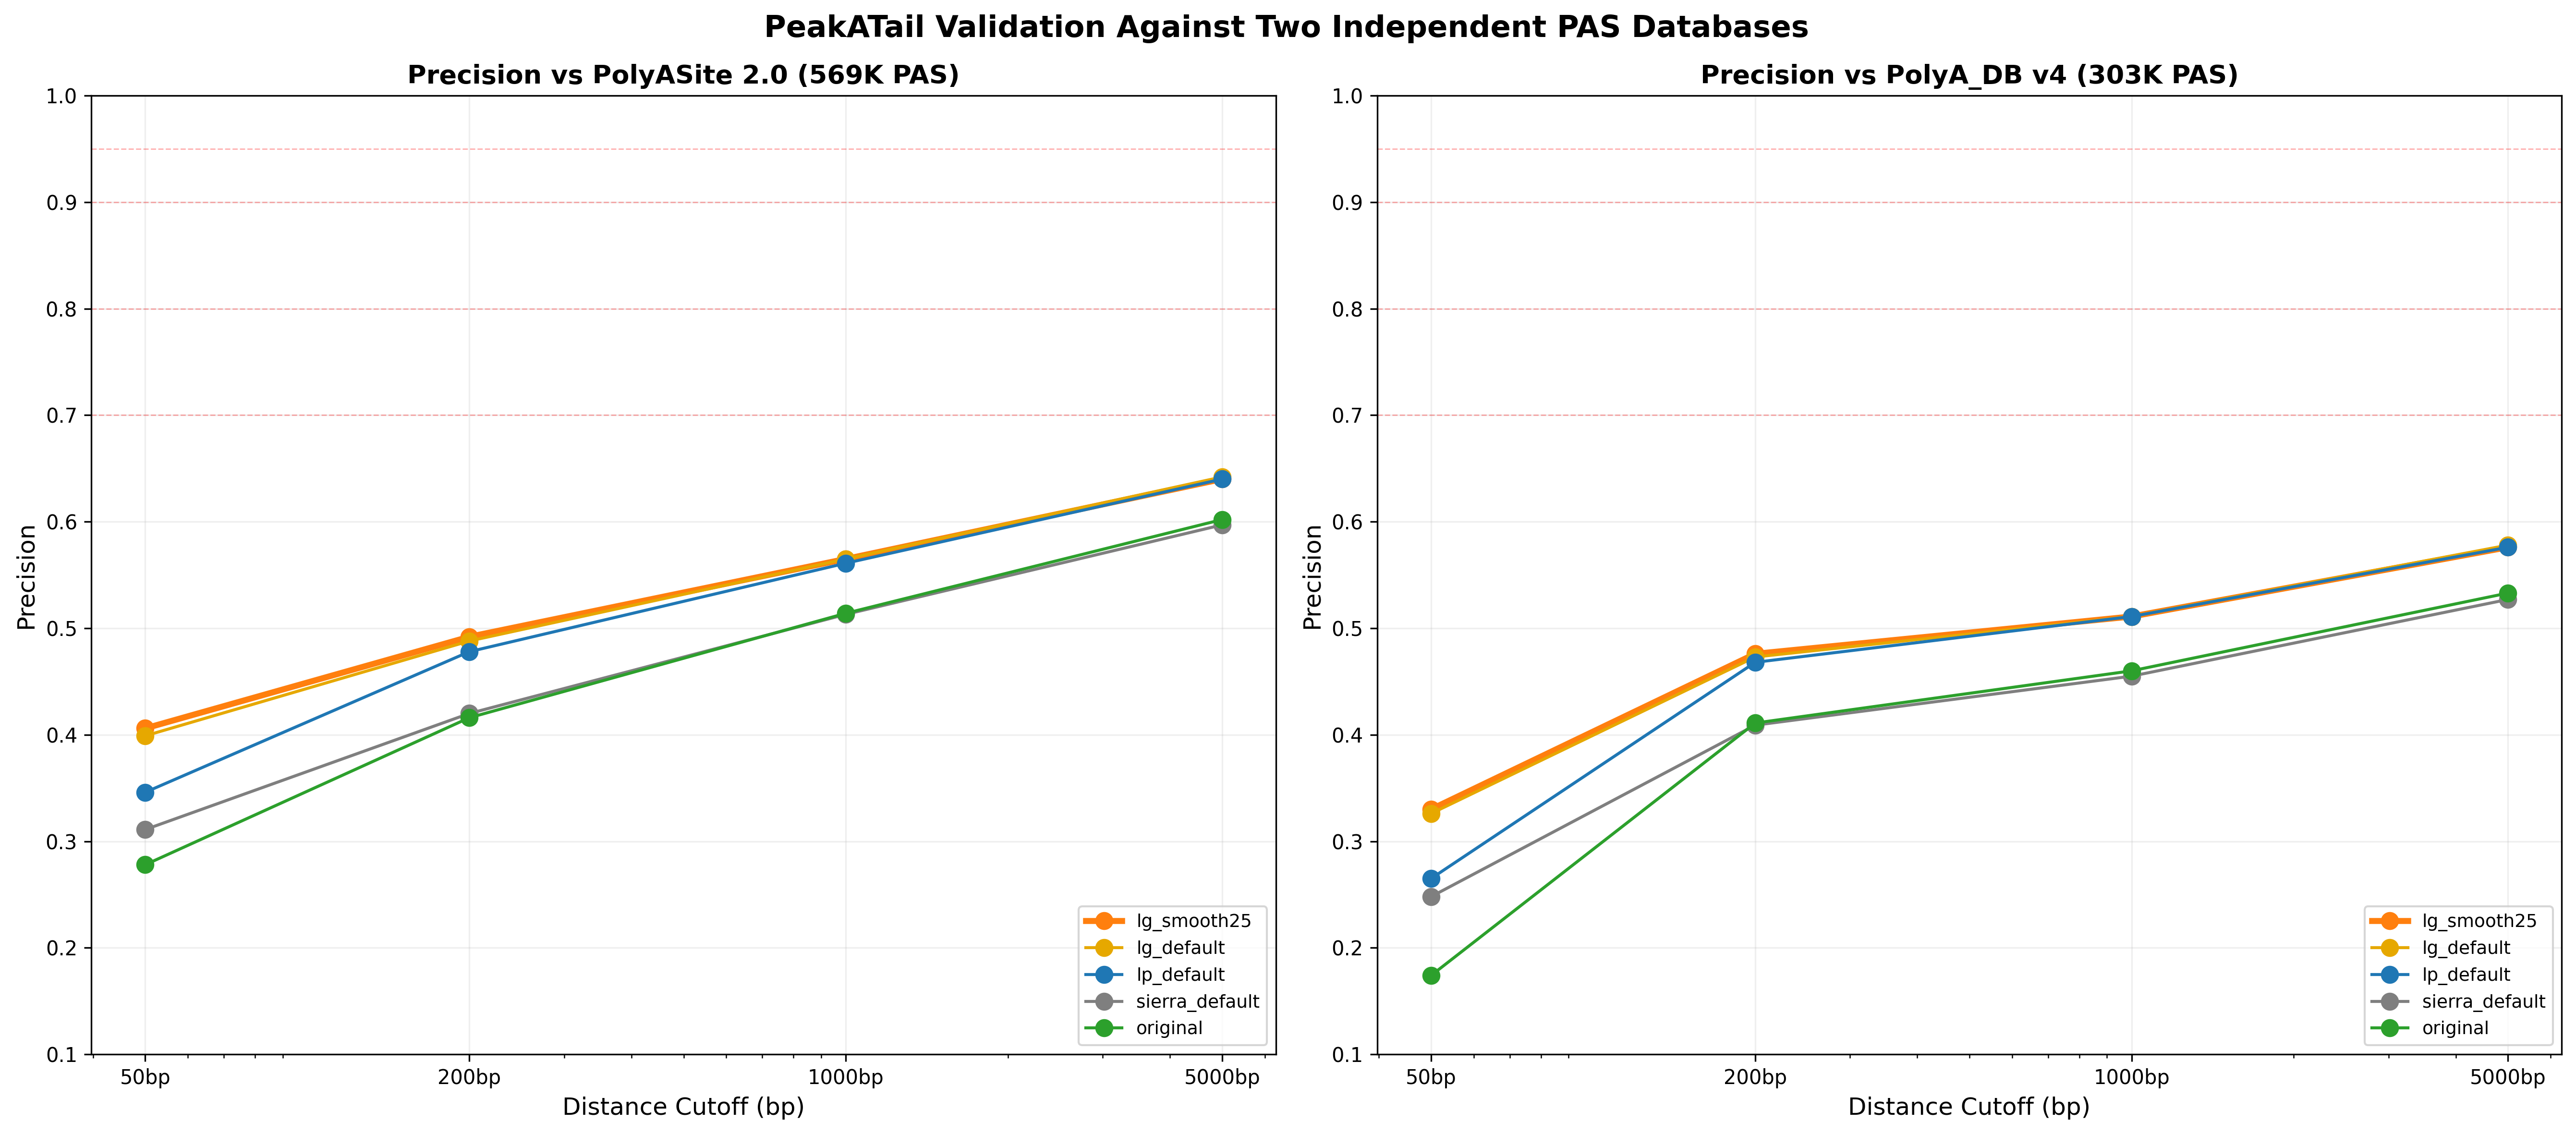 Validation against both PolyASite 2.0 and polyA_DB v4 — agreement metrics
across both databases independently.
Validation against both PolyASite 2.0 and polyA_DB v4 — agreement metrics
across both databases independently.
Choosing a strategy
A pragmatic decision tree:
Are you comparing against an existing PeakATail run from before
the strategy refactor?
  └─ Yes → use `original` (exact reproducibility)
  └─ No  →
      Does your BAM keep untrimmed poly(A) tails as soft clips?
        (check the startup clip-rate line: >0.3% of CB reads)
        ├─ Yes → use `clip_seeded` — best PAS positional accuracy;
        │        report its two tiers separately
        └─ No  →
            Do you want multiple PAS per UTR?
              ├─ No  → use `lambda_poisson` (single-summit + significance)
              └─ Yes →
                  Do you also want a significance test per summit?
                    ├─ No  → use `sierra_iterative` (fastest multi-PAS)
                    └─ Yes → use `lambda_gradient` (multi-PAS + p-value)
The default in the YAML schema is lambda_gradient. clip_seeded is the
accuracy-oriented choice where the chemistry supports it; it uses
lambda_gradient internally for its second tier, so nothing is lost.
See also
peakatail run—--peak-strategyflag selects the strategy- PeakATail Technical Report — full benchmark methodology