Gene track deep dive
ema switch geneview generates a single-page summary for one or more genes, showing where PAS fall along the gene body and how each cluster uses them. Use it after ema switch diff to turn a list of significant PAS IDs into a visual you can put in a presentation or paper.
When to use geneview
Use geneview when you want to:
- Confirm that a significant differential PAS from the Fisher TSV maps to the expected 3' end region.
- Compare PAS usage across all clusters simultaneously in one figure.
- Show a reviewer that the signal is real and not an artifact of a single cluster.
Do not use geneview as the first analysis step. Run ema switch diff first to identify which genes carry significant differential PAS, then call geneview on the top hits.
Minimal invocation
uv run ema switch geneview \
  --diff-tsv peakatail_runs/full_v8_2026-05-11_152746/switch_diff_2026-05-11_205015/differential/fisher_0_vs_4.tsv \
  --pasbed peakatail_runs/full_v8_2026-05-11_152746/per_dataset/only/pasbed.bed \
  --h5ad peakatail_runs/full_v8_2026-05-11_152746/per_dataset/only/clusters.h5ad \
  --top-genes 5
--diff-tsv accepts the per-pair Fisher TSV from ema switch diff. --top-genes 5 auto-selects the five genes with the strongest aggregate signal (ranked by sum of |log2fc| × −log₁₀(q) across all significant PAS for that gene). --pasbed provides the coordinate map from PAS ID integers to genomic positions. --h5ad is the clustered AnnData.
Output lands in:
peakatail_runs/full_v8_2026-05-11_152746/switch_geneview_<timestamp>/
  figures/
    gene_ENSG00000103275.png
    gene_ENSG00000103275.svg
    gene_ENSG00000103275.meta.json
    gene_ENSG00000100600.png
    ...
    figures_INDEX.md
    figures_INDEX.json
Invocation with GTF for isoform structure
Add --gtf to annotate known transcript boundaries in the gene body panel:
uv run ema switch geneview \
  --diff-tsv peakatail_runs/full_v8_2026-05-11_152746/switch_diff_2026-05-11_205015/differential/fisher_0_vs_4.tsv \
  --pasbed peakatail_runs/full_v8_2026-05-11_152746/per_dataset/only/pasbed.bed \
  --h5ad peakatail_runs/full_v8_2026-05-11_152746/per_dataset/only/clusters.h5ad \
  --gtf /path/to/Homo_sapiens.GRCh38.99.gtf \
  --top-genes 5
Without --gtf the gene body panel shows only the gene locus extent (start to end), not individual transcript models. With --gtf exon blocks are drawn where the reference annotation has them, making it easy to see whether a PAS falls inside the annotated 3'UTR or downstream of the last exon.
Specifying explicit gene IDs
Use --gene-id to override auto-selection or add specific genes:
uv run ema switch geneview \
  --diff-tsv .../fisher_0_vs_4.tsv \
  --pasbed .../pasbed.bed \
  --h5ad .../clusters.h5ad \
  --gene-id ENSG00000103275 \
  --gene-id ENSG00000100600 \
  --top-genes 0
--top-genes 0 disables auto-selection so only the explicitly listed genes are rendered. Combine --gene-id and --top-genes N to get both the auto-selected top N and any genes you add manually.
Reading the figure
Here is the gene track figure for ENSG00000103275 (chr16:1317072-1326901, positive strand) produced from the full_v8 run:
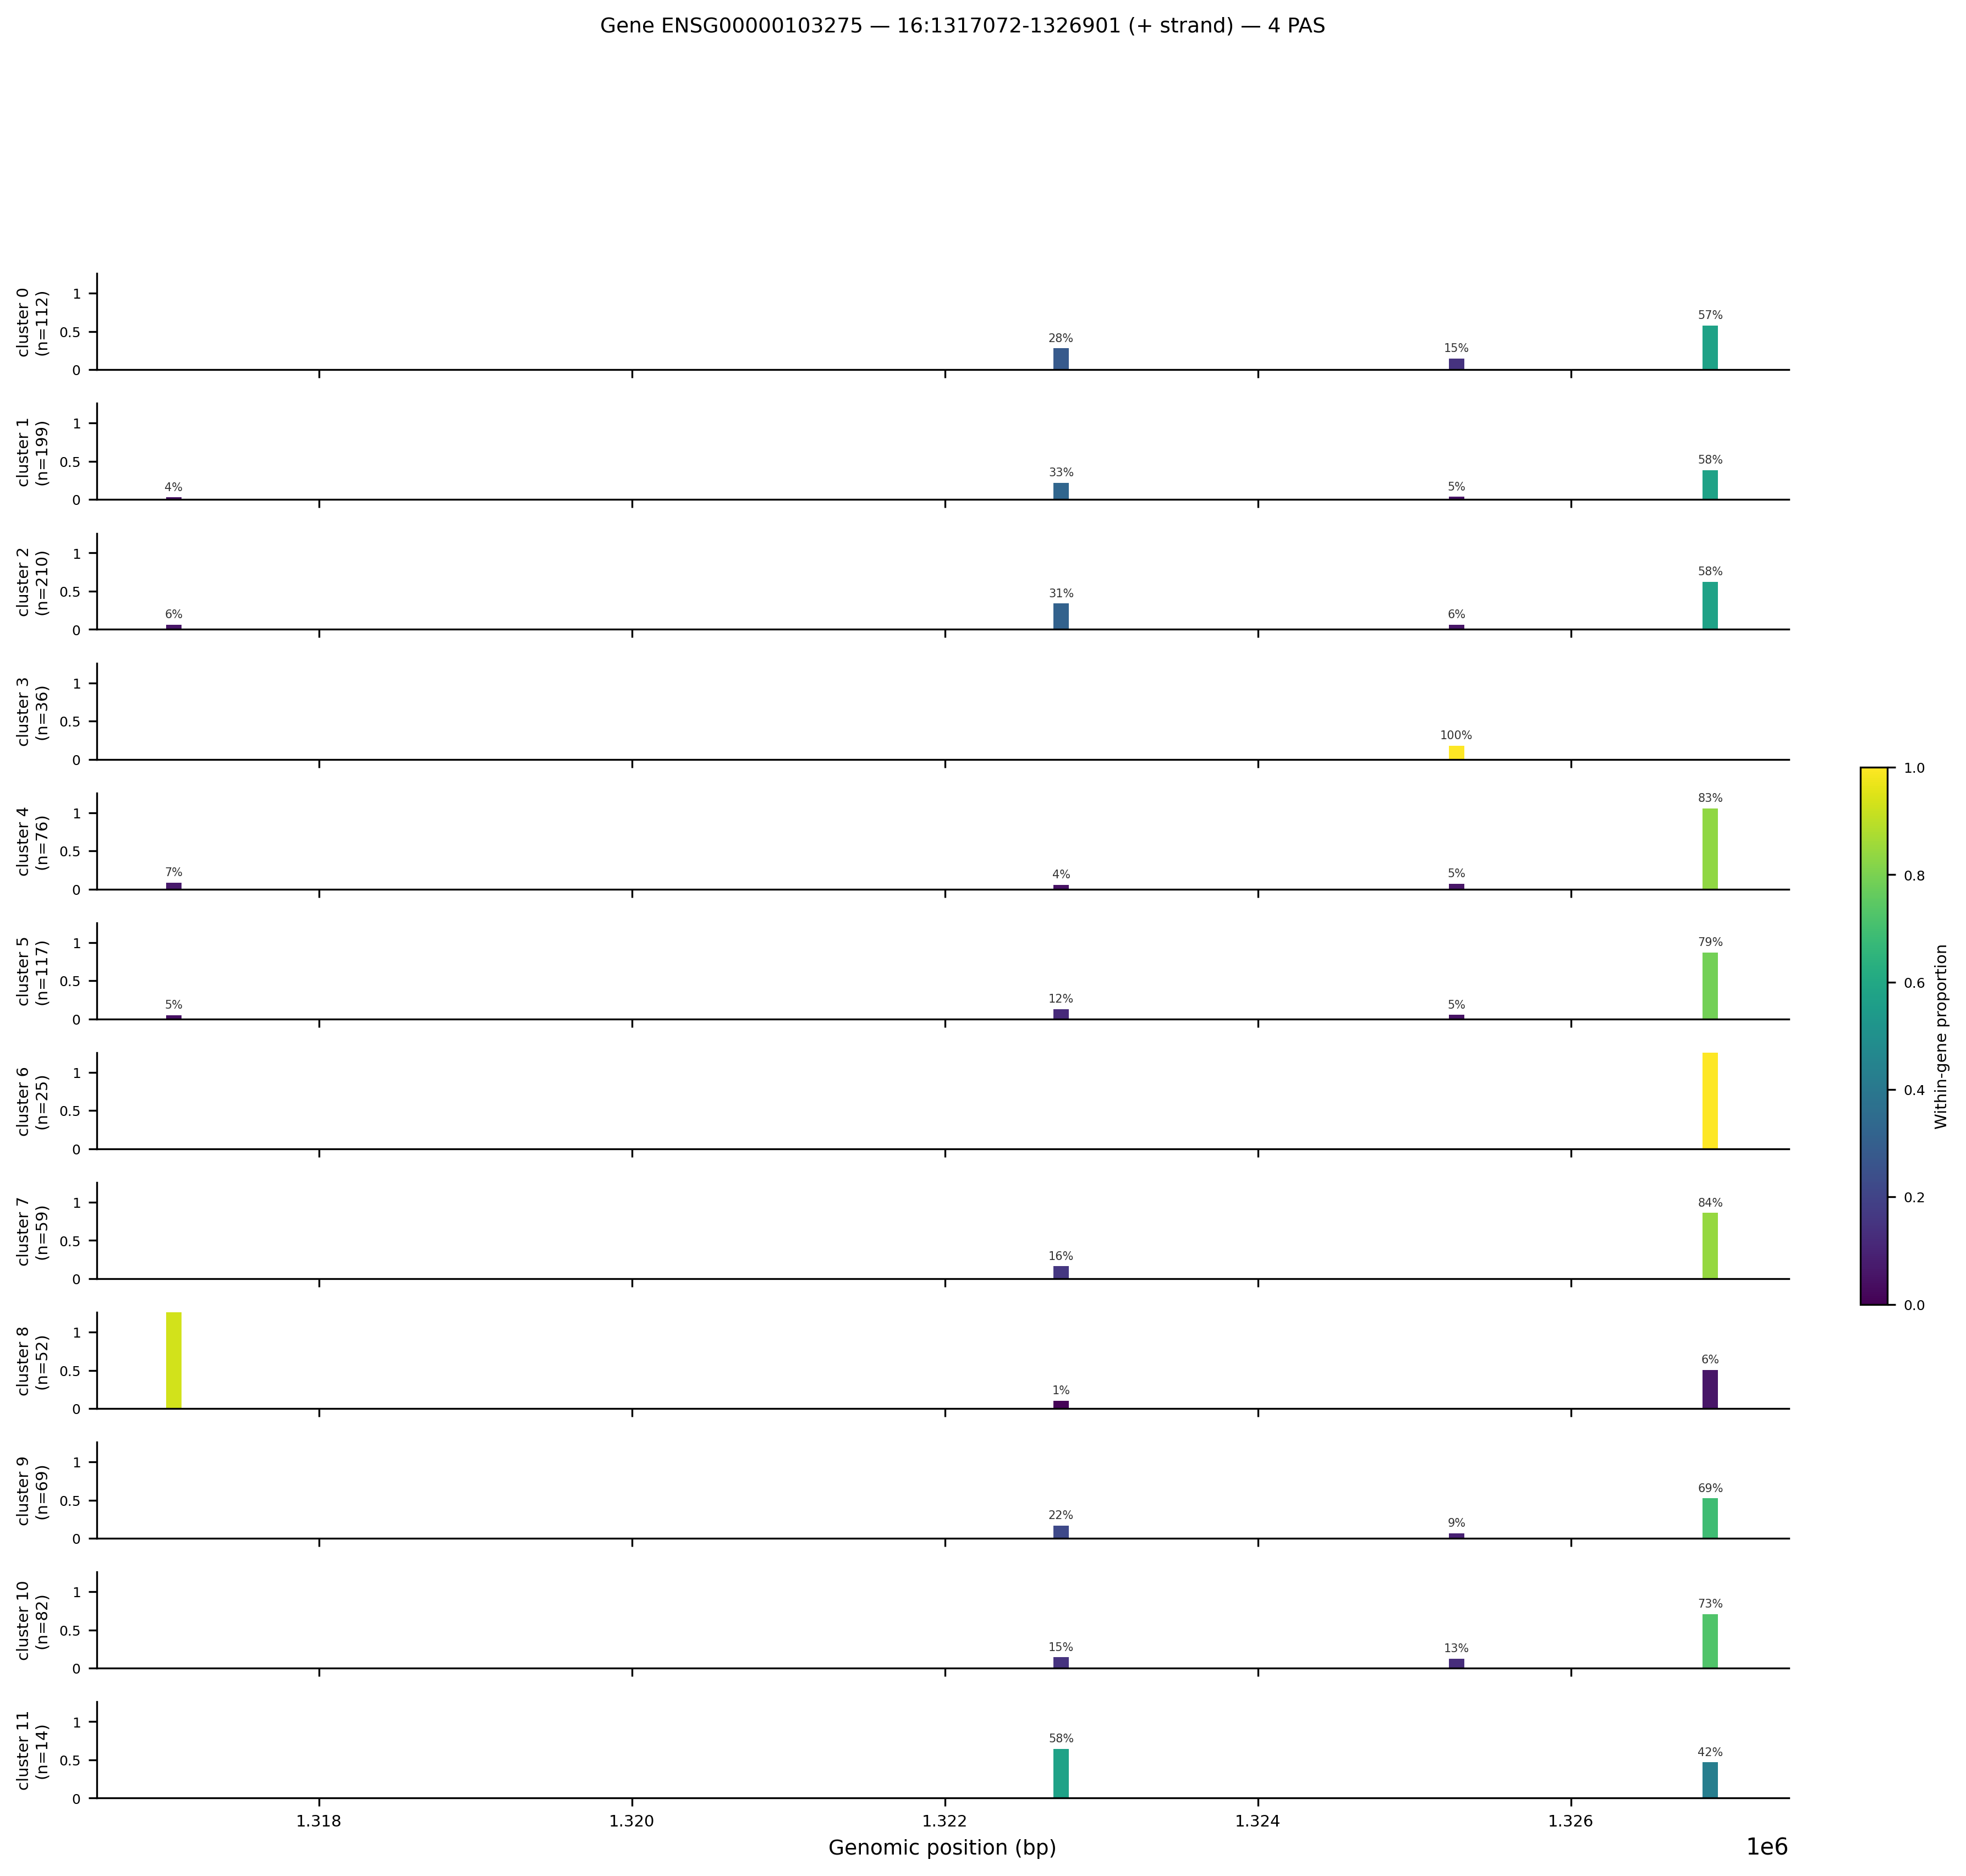 Gene track for ENSG00000103275 on chromosome 16 (+ strand). The x-axis is genomic position in bp. Each row is one Leiden cluster (labelled with cluster number and cell count). The y-axis within each row is normalised reads per cell. Colour encodes within-gene proportion: yellow = this PAS carries most of the gene's reads in that cluster, dark blue = low proportion.
Panel layout:
- Each horizontal strip is one cluster, ordered cluster 0 at top through cluster 11 at bottom.
- The cell count for that cluster appears in the label on the left (e.g.
cluster 0 (n=112)). - Each vertical bar at a genomic coordinate is a PAS. Bar height is the mean reads per cell at that PAS, normalised so the tallest bar in the panel reaches 1.0.
- Colour encodes the within-gene proportion: the fraction of that gene's total reads in that cluster that come from this specific PAS. Yellow (proportion = 1.0) means all the gene's reads go through this one PAS. Dark blue (proportion near 0) means this PAS contributes little relative to other PAS of the same gene.
- The percentage annotation above each bar is the within-gene proportion rounded to the nearest integer.
Reading this specific figure:
- PAS at ~1326800 (rightmost, distal PAS) dominates most clusters (57–94% of reads). This is the canonical distal polyadenylation site for this gene on the positive strand.
- Cluster 8 is strikingly different: the leftmost PAS at ~1317100 (proximal, closest to the stop codon) carries most of cluster 8's reads (yellow bar). This cluster uses the short 3'UTR isoform almost exclusively.
- Cluster 11 splits roughly 50/50 between the central PAS at ~1322400 and the distal PAS, suggesting heterogeneous isoform usage within this small cluster (n=14 cells).
The .meta.json sidecar confirms the rendering parameters:
{
  "gene_id": "ENSG00000103275",
  "chrom": "16",
  "start": 1317072,
  "end": 1326901,
  "strand": "+",
  "n_pas": 4,
  "n_clusters_rendered": 12,
  "top_proportion_per_cluster": {
    "0": 0.57,
    "3": 1.0,
    "8": 0.93,
    ...
  }
}
Figures index
The auto-generated figures_INDEX.md lists every gene rendered in a geneview run:
# Figures index

Produced by `ema switch geneview`.

Directory: .../switch_geneview_2026-05-11_212341/figures

Total figures: 5 across 1 plot type(s).

## `gene_track` (5)

- **gene_ENSG00000100600** (2 files)
- **gene_ENSG00000103275** (2 files)
- **gene_ENSG00000105939** (2 files)
- **gene_ENSG00000160087** (2 files)
- **gene_ENSG00000168899** (2 files)
Each entry has a .png (for documents) and a .svg (for scalable embedding). The figures_INDEX.json provides the same information in machine-readable form for programmatic access.