Switch analysis — a full biological story
This tutorial works through a real differential APA result from the full_v8_2026-05-11_152746 run. By the end you will:
- Locate a statistically significant PAS in the differential TSV.
- Decode every column in the output row.
- Run
ema switch lengthto compute PDUI per cell. - Interpret PDUI distributions across clusters.
- Draw a biological conclusion about 3'UTR isoform usage.
Background
After ema run completes, you have clusters.h5ad files under per_dataset/<id>/. Running ema switch diff tests every cluster pair for differential APA and produces one TSV per pair in differential/. The full_v8 run produced 66 TSVs (12 clusters → 66 unique pairs).
For this tutorial we work with the cluster 0 vs cluster 4 comparison. The volcano from the figures_INDEX.md shows 935 significant PAS out of 1433 tested — a strong signal.
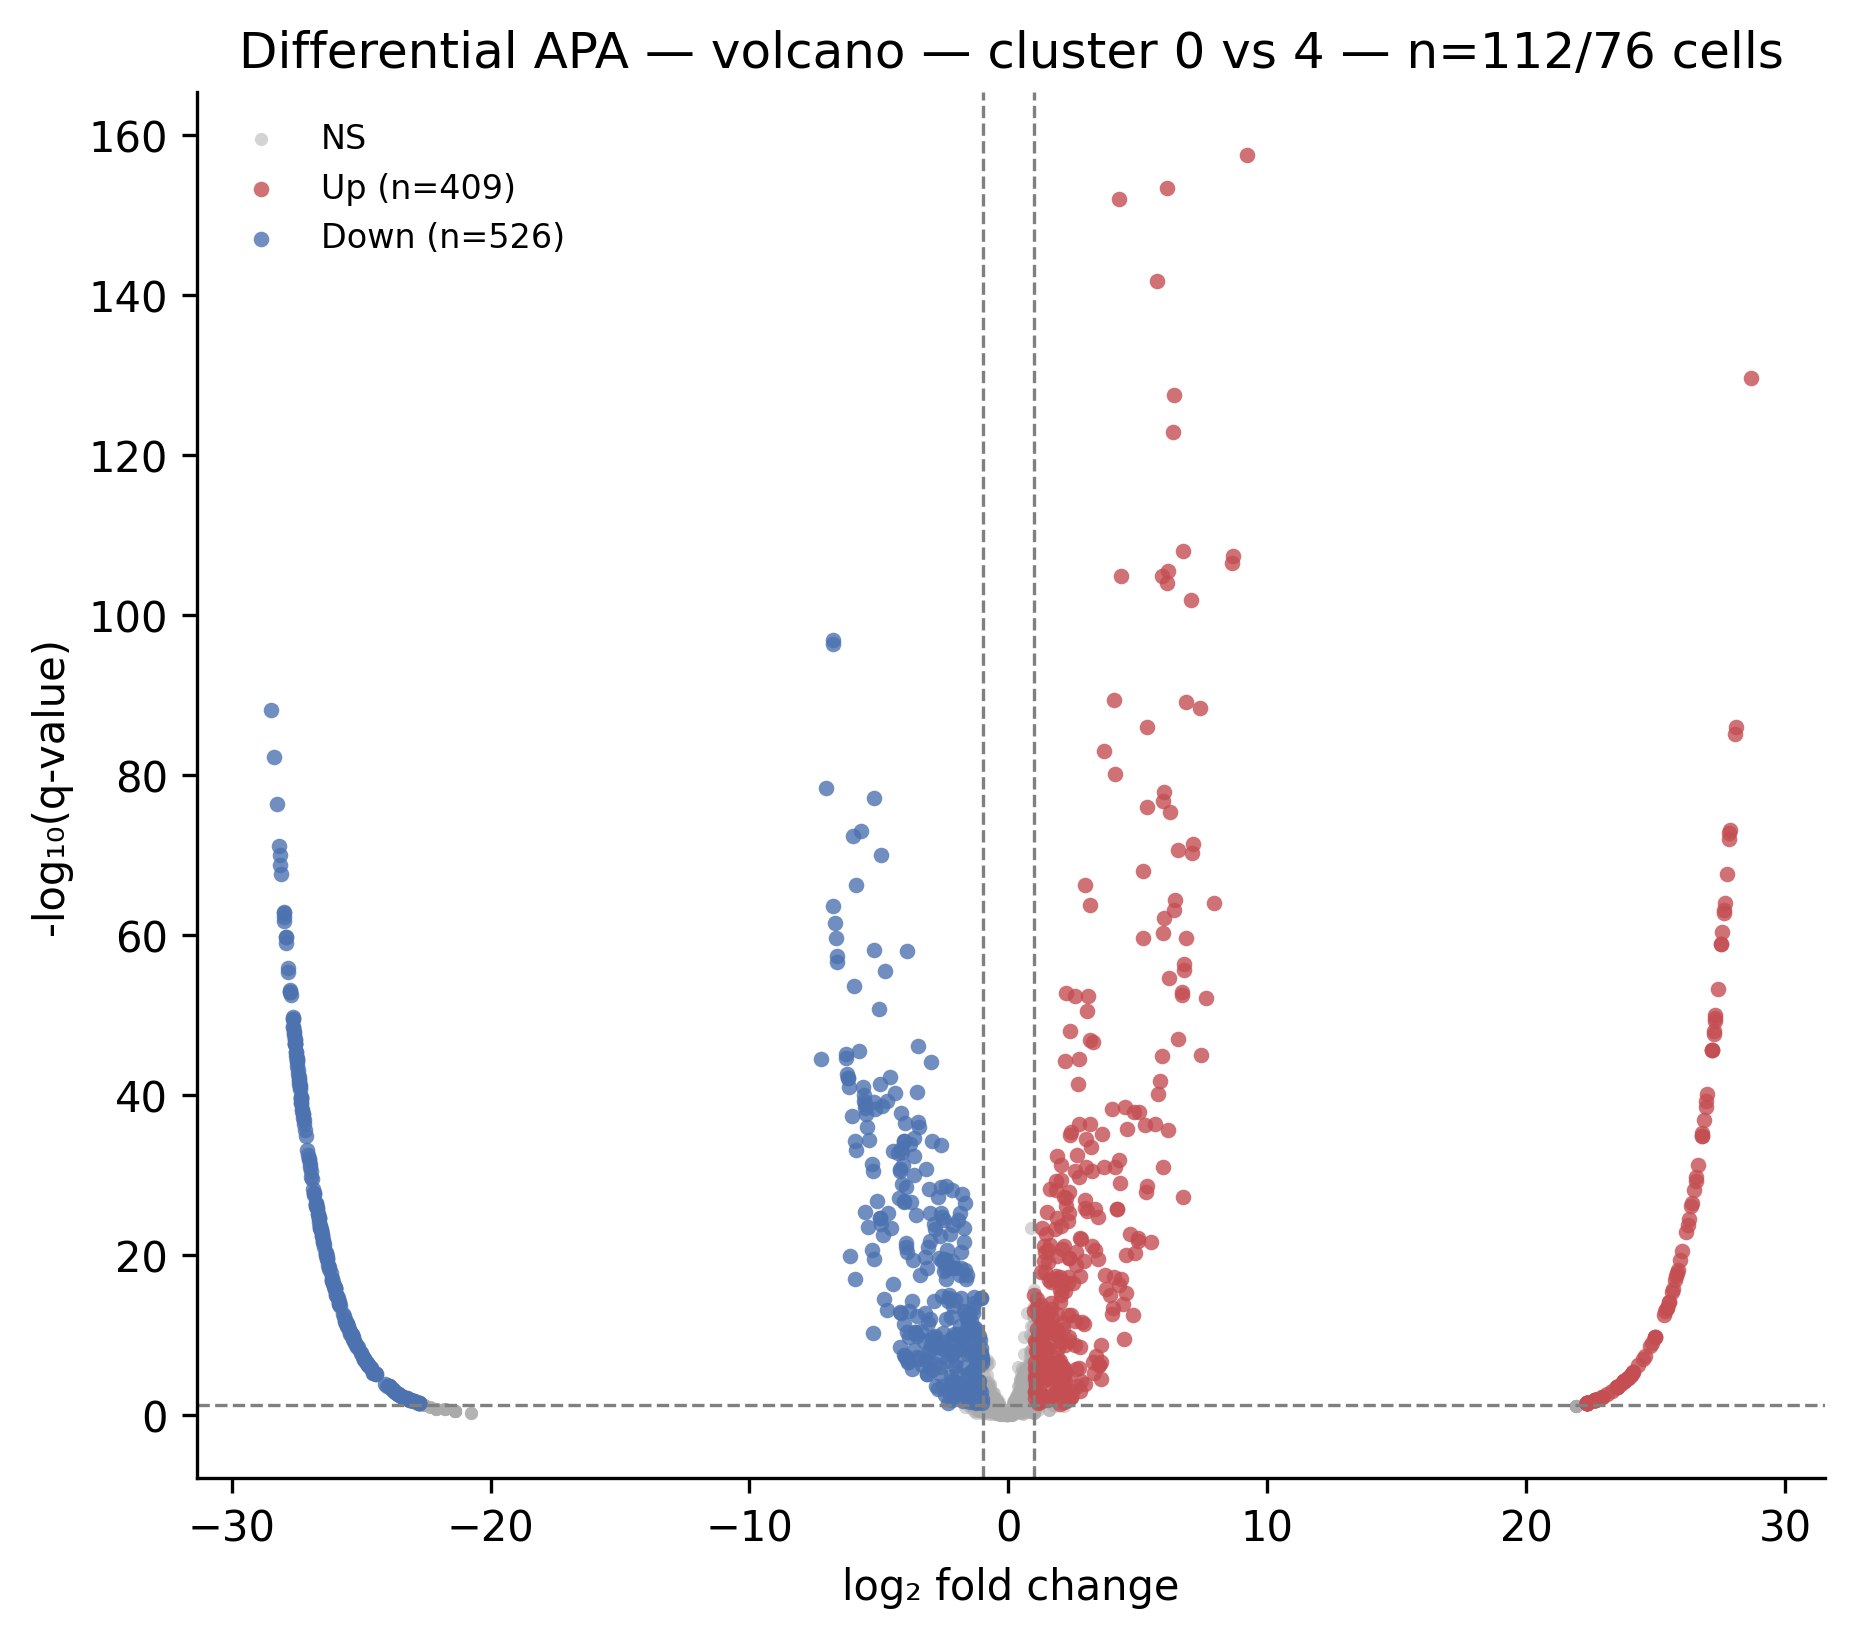 Differential APA volcano for cluster 0 (n=112 cells) vs cluster 4 (n=76 cells). Red dots = higher usage in cluster 4; blue dots = higher usage in cluster 0. The vertical axis is −log₁₀(q-value); the horizontal axis is log₂ fold change.
Step 1 — Find the differential TSV
Open the cluster 0 vs 4 file:
head -3 peakatail_runs/full_v8_2026-05-11_152746/switch_diff_2026-05-11_205015/differential/fisher_0_vs_4.tsv
Output:
pas_id  gene_id         chrom  start     end       strand  cluster1  cluster2  pvalue                   qvalue                   n_cells  n_cells_cluster1  n_cells_cluster2  n_reads_pas_cluster1  n_reads_pas_cluster2  odds_ratio             delta_proportion         log2fc
23926   ENSG00000254004  19     36524704  36524709  -       0         4         2.361e-161               3.383e-158               188      112               76                1                     401                   0.00161                -0.00404                 9.207
233     ENSG00000173372  1      22639574  22639574  +       0         4         6.555e-157               4.697e-154               188      112               76                9                     424                   0.01367                -0.00422                 6.117
Step 2 — Decode the row
Here is the top row from fisher_0_vs_4.tsv copied verbatim. The TSV was produced by ema switch diff --strategy fisher on this branch:
pas_id  = 23926
gene_id = ENSG00000254004
chrom   = 19
start   = 36524704
end     = 36524709
strand  = -
cluster1 = 0
cluster2 = 4
pvalue  = 2.3606913263552954e-161
qvalue  = 3.3828706706671383e-158
n_cells = 188
n_cells_cluster1 = 112
n_cells_cluster2 = 76
n_reads_pas_cluster1 = 1
n_reads_pas_cluster2 = 401
odds_ratio = 0.0016057205355215496
delta_proportion = -0.004043392416462504
log2fc = 9.206884221985684
Column-by-column explanation:
| Column | Value | Meaning |
|---|---|---|
pas_id |
23926 | Internal integer ID assigned during peak-calling. Corresponds to the 4th column of pasbed.bed. |
gene_id |
ENSG00000254004 | Ensembl gene assigned by find_close() based on UTR proximity. |
chrom |
19 | Chromosome (GRCh38). |
start |
36524704 | PAS start coordinate (0-based, half-open BED format). |
end |
36524709 | PAS end coordinate. |
strand |
- | Negative strand; PAS is at the 3' end of the gene on the minus strand. |
cluster1 |
0 | Reference cluster (112 cells). |
cluster2 |
4 | Comparison cluster (76 cells). |
pvalue |
2.36e-161 | Fisher exact test p-value (two-sided). |
qvalue |
3.38e-158 | Benjamini-Hochberg FDR-corrected q-value across all PAS tested in this pair. |
n_cells |
188 | Total cells across both clusters with data for this PAS. |
n_cells_cluster1 |
112 | Cells in cluster 1 that had at least one read at any PAS in this gene. |
n_cells_cluster2 |
76 | Cells in cluster 2. |
n_reads_pas_cluster1 |
1 | Aggregate reads at PAS 23926 from cluster 0 cells. |
n_reads_pas_cluster2 |
401 | Aggregate reads at PAS 23926 from cluster 4 cells. |
odds_ratio |
0.00161 | Odds ratio from the 2×2 contingency table. Values < 1 mean the PAS is used proportionally less in cluster 1 vs cluster 2. |
delta_proportion |
-0.00404 | Difference in within-gene PAS usage proportion: cluster1 − cluster2. Negative = PAS 23926 contributes a larger fraction of gene reads in cluster 4 than in cluster 0. |
log2fc |
9.21 | log₂(usage in cluster 4 / usage in cluster 0) at this PAS, computed from pseudo-count-stabilised proportions. High positive value = dramatically higher usage in cluster 4. |
Biological interpretation of this row: PAS 23926 on chr19 (gene ENSG00000254004, minus strand) has 1 read in cluster 0 and 401 reads in cluster 4. It passes at FDR < 10⁻¹⁵⁷. The log2fc of 9.2 means cluster 4 uses this specific 3' end roughly 600-fold more than cluster 0. This is a dominant distal PAS in cluster 4 that is essentially unused in cluster 0.
Step 3 — Run ema switch length for PDUI
The Fisher test tells you which PAS differ. PDUI (Proximal-Distal Usage Index) tells you the aggregate 3'UTR length direction: are cells in cluster 4 using longer or shorter 3'UTR isoforms overall?
uv run ema switch length \
  --h5ad peakatail_runs/full_v8_2026-05-11_152746/per_dataset/only/clusters.h5ad \
  --strategy classic \
  --isoform-agg per_gene
This writes switch_length_<timestamp>/pdui_classic.tsv inside the run directory. The classic strategy computes:
where "proximal" is the PAS closest to the stop codon and "distal" is the PAS farthest from the stop codon (per gene, per cell).
Output columns in pdui_classic.tsv:
gene_id        transcript_id  cell                    pdui
ENSG00000176022  _gene_       only_CACATTTGTGTGACGA  1.0
ENSG00000176022  _gene_       only_GGTTTCTAGTCTTCGG  0.0
...
transcript_id = _gene_ indicates per_gene aggregation (the distal/proximal split is over the gene's full PAS set, not any specific isoform).
pdui = 1.0 means the cell used only the distal (long) 3'UTR isoform; pdui = 0.0 means only the proximal (short) isoform.
Step 4 — Interpret the PDUI distribution figure
The length run automatically generates a violin plot:
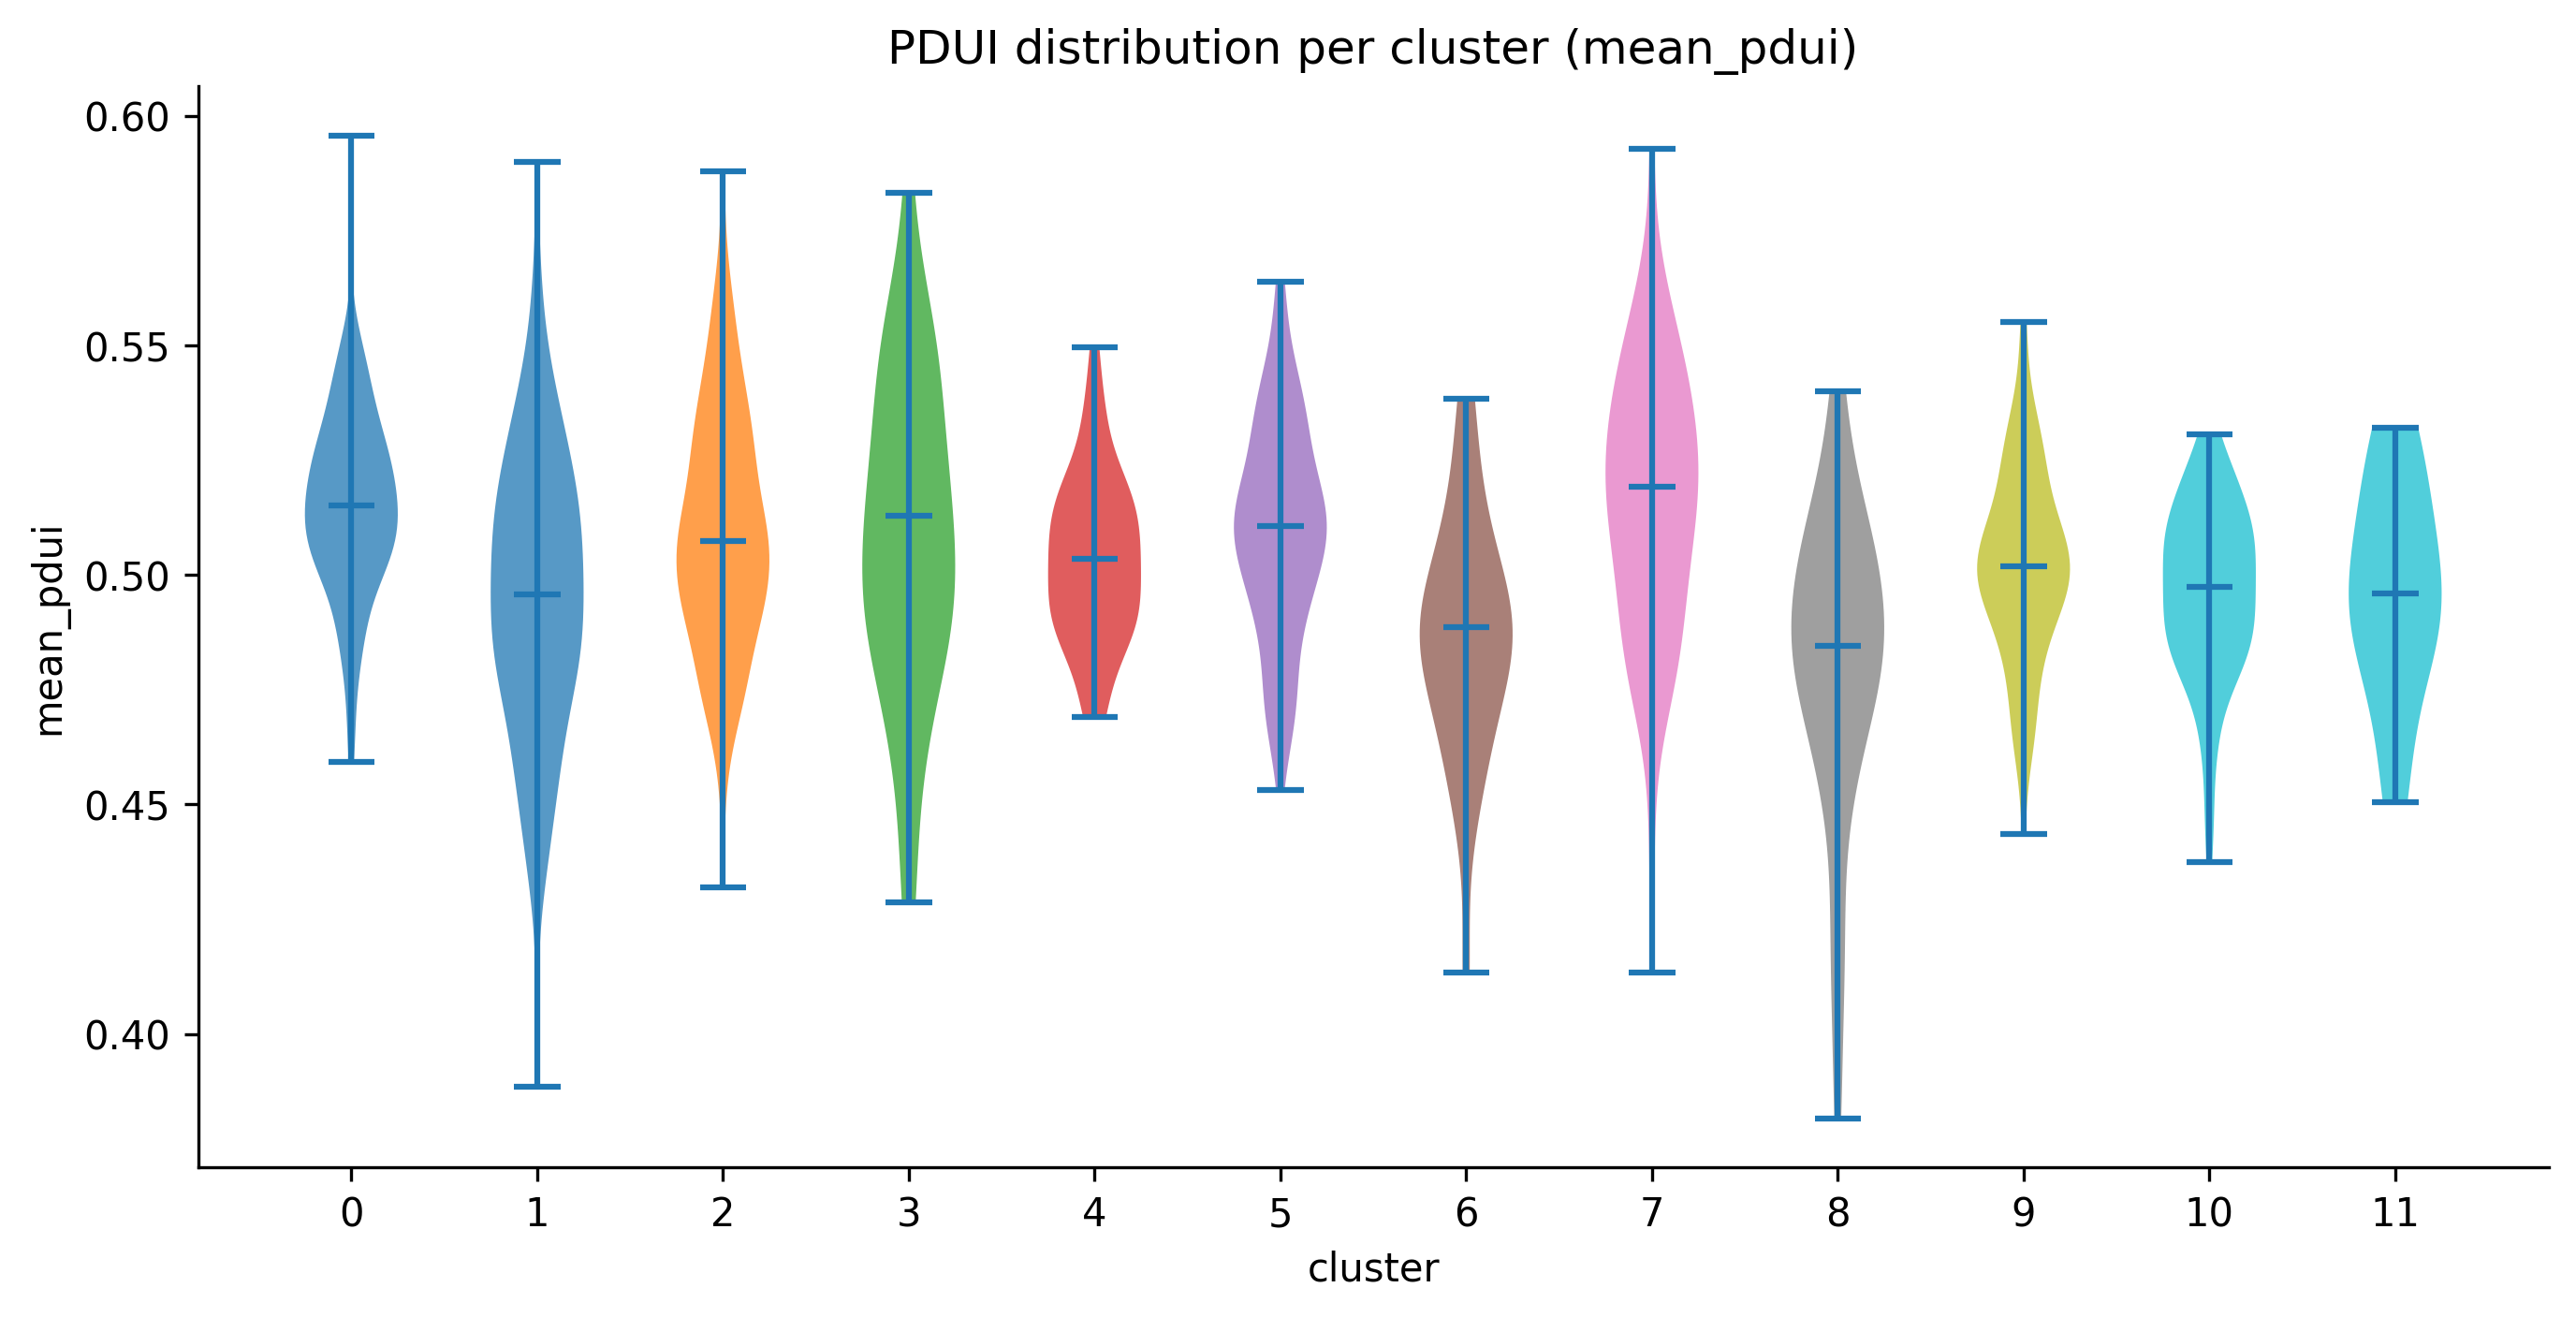 Violin plot showing the distribution of per-cell mean PDUI scores across all 12 clusters. The y-axis (mean_pdui) ranges from 0 (all reads at the proximal PAS) to 1 (all reads at the distal PAS). The dashed horizontal line at 0.5 is the isometric point: above it cells favour the long isoform, below it they favour the short isoform.
Reading the figure for the full_v8 data:
- All clusters centre near 0.50, meaning the sample as a whole does not have a strong global APA bias.
- Cluster 1 shows a wider distribution and lower median (~0.49) than cluster 3 (median ~0.51), consistent with the Fisher test finding many PAS differentially used between these clusters.
- Cluster 7 has the widest spread (0.39 – 0.59), suggesting high cellular heterogeneity in 3'UTR choice within that cluster.
A PDUI difference of 0.1 between two clusters corresponds to a meaningful shift in 3'UTR isoform balance at the gene level, comparable in effect size to what scDaPars and scAPAtrap report as significant APA events in published single-cell datasets.
Step 5 — Run the proportion strategy for a second view
The proportion strategy computes a different quantity: for each cell and each PAS, the fraction of total gene reads that land at that specific PAS. This is complementary to PDUI (which only uses the proximal/distal pair):
uv run ema switch length \
  --h5ad peakatail_runs/full_v8_2026-05-11_152746/per_dataset/only/clusters.h5ad \
  --strategy proportion \
  --isoform-agg per_gene
Output: pdui_proportion.tsv (the filename comes from PDUIStrategy.output_filename).
gene_id         transcript_id  pas_id  rank  cell                    proportion
ENSG00000187583  _gene_        11      1     only_CACATTTGTGTGACGA   1.0
ENSG00000187583  _gene_        11      1     only_TGACTTTGTACTTAGC   0.0
rank is the PAS rank within the gene (1 = proximal-most). proportion is the fraction of that gene's reads in that cell attributable to this PAS. A cell where rank=1 has proportion=1.0 exclusively uses the most proximal PAS.
Conclusion
The cluster 0 vs 4 Fisher comparison identifies PAS 23926 (chr19:36524704-36524709, gene ENSG00000254004, minus strand) as the most significantly differentially used site. Cluster 4 cells use this PAS ~600-fold more than cluster 0 cells (log2fc = 9.21, q = 3.4×10⁻¹⁵⁸). The PDUI distribution shows the clusters sit near 0.50 on average, but the PAS-level resolution from Fisher reveals that specific 3' ends within individual genes are strongly cluster-specific. This is the hallmark of alternative polyadenylation as a cell-type regulatory mechanism: total expression of a gene can be similar between clusters while the 3'UTR isoform balance differs substantially.